The Default investment

This post was originally published on my GoodeValue.com blog on 7/27/2007. Due to blog moves it was not correctly moved to this blog so I have reposted it. 

In what should you invest if you know nothing about investing? While there are plenty of people (most readers of my blog) who enjoys spending time seeking out new and attractive investments, there are plenty of people who do not enjoy that, do not have the time, or do not have the knowledge or the desire to gain the knowledge necessary to invest well. Luckily, there are some good solutions for such “defensive investors”. The standard advice for defense of investors has been to invest in index funds. This is a great idea.

Unfortunately, there are now hundreds of different index funds in many different asset classes. So even choosing in which index funds to invest is now a complicated decision. Luckily, there are now many target date funds. These are funds that are set up for investors who wish to withdraw their money gradually starting on a certain date, usually because of retirement but for other reasons such as paying for college for children as well. So let’s say that you are investing for retirement starting approximately 2040 and paying for your children’s college education starting in 2025. You estimate that it will cost $200,000 for each of your two children and that you will need at least $2 million at the start of retirement. You can plug these numbers in any of various online retirement or savings calculators to calculate how much you will need to save. Then, you invest in two different target date index funds through Vanguard: a 2025 target date fund and the 2040 target date fund.

You use those handy online calculators again to determine how much you’ll need to put into each fund to reach your goals. All that is left for you to do is to faithfully put away money into each of those funds every month like clockwork. You will never have to think about your investments again, except for occasionally checking to make sure that you are progressing well towards your goals. Those target date funds will do all the work for you, investing mostly in stocks at first and gradually sticking more money into bonds as your target date approaches. And the only target date funds you should consider are Vanguard’s funds, because they have the lowest fees around, about 0.21% per year. I think the above plan is the easiest and most generally appropriate plan for the majority of individual investors. However, your investment needs may differ, in which case you may wish to seek out a certified financial planner (CFP) who is compensated on an hourly basis to offer you unbiased and personalized investment advice.

Disclosure: Disclaimer: I own some Vanguard index funds in an IRA and my wife owns a Vanguard ETF in an IRA. We have no target-date funds–all our investments in retirement accounts are in cash or stocks. This blog has a terms of use that is incorporated by reference into this post; you can find all my disclaimers and disclosures there as well..

An Introduction to evidence-based investing

This post was originally published on my GoodeValue.com blog on 3/18/2009. Due to blog moves it was not correctly moved to this blog so I have reposted it. 

The Plight of the Ordinary Investor

A few finance professors measured the performance of all investors in Taiwan over a period of years by looking at the data direct from the exchange. They found that individual investors and traders underperformed the Taiwanese stock market by an average of 3.8 percentage points per year. Institutions outperformed by an average of 1.5 percentage points. While comprehensive data such as these are not available in the United States, smaller surveys have consistently shown that individual investors underperform the broad market, whether they buy individual stocks or mutual funds or hedge funds. Individual investors are often like kids suffering from shiny ball syndrome: whatever stock is hot or in the news catches their attention and they buy it; they trade too much generating lots of commissions, sub-par returns, and big tax bills. Such ‘investing’ is the opposite of rational investing.

This article will show you the way to avoid becoming just another losing individual investor (not that only individual investors do poorly—Alfred Cowles’ pioneering research 70 years ago showed that both stock newsletters’ and insurance companies’ stocks picks underperformed the market as a whole). This is the definitive guide not about how to invest, but about how to learn to invest.

Certainty and Overconfidence

I recently asked readers of my blog on Motley Fool CAPS whether they were good or bad drivers. Driving skill should be only loosely correlated with interest in investing (the very young are horrid drivers and are unlikely to be avid investors, while the very old are poor drivers and are unlikely to be reading blogs), so while this is not a representative sample I had no doubt that my little poll would replicate more scientific polls. What I found was unsurprising to me: out of 159 responses, 46% rated themselves as “above average drivers”, 44% rated themselves as “average drivers”, and only 10% rated themselves as “below average drivers.” In driving as well as in other endeavors, people believe that they are smarter, more attractive, and better than they are in reality. I decided to replicate this study by asking my blog readers about their attractiveness: while 39% of 102 respondents thought they were in the most attractive third of the population, only 22% said they were in the least attractive third of the population. What is amazing is that people can be overconfident about anything: in a third poll I asked the simple and nonsensical question “Quack?” to which 58% of 66 respondents replied “Quack!!!!!!!!!!!” while only 42% responded “Quack?”.

Most people are overconfident most of the time (this is sometimes known as the Lake Wobegon Effect). This has advantages. Those who are not overconfident never dare to dream and to try to do unlikely things. Thus they never accomplish as much as the overconfident do. To misquote George Bernard Shaw, “The diffident man adapts himself to the world: the overconfident one persists in trying to adapt the world to himself. Therefore all progress depends on the overconfident man.” If people were not overconfident they would apply to far fewer jobs, they would have fewer dates, there would be fewer world records and less greatness.

But in certain areas our human tendency towards overconfidence acts as a tether rather than as a pair of wings. One of these situations is investing. People are generally overconfident in their abilities as investors, just as they are in other aspects of their lives. Professor Terrence Odean has theorized that investors become overconfident because they attribute their successes to skill while forgetting about or attributing to bad luck their failures. One of the key findings in the psychological study of overconfidence is that the worst performers are the most overconfident; they have the worst ‘calibration’, or understanding of their own skill. This miscalibration prevents underperformers from correcting their errors. The first step in fixing a problem is to realize that a problem exists.

Improving Investment Performance First Requires Measuring It

How much do you weigh? While people may not like this question, most people can answer it accurately. Anyone who cares about their weight or fitness can probably recite a reasonably accurate history of how their weight has fluctuated over the last couple years. If you care about your health and fitness more than about your weight, you can probably recite other statistics, such as how quickly you can run a mile, how much you can bench-press, and what your resting heart rate is. This makes perfect sense: if an athlete did not measure her progress, how could she know if she were training correctly?

People purport to care about their investment returns. In reality, few really care. If they did care, they would put forth the effort to accurately track their investment performance. Back when I was a more normal investor, holding several mutual funds and maybe 15 stocks, I set forth to measure my investment performance. It took me about 20 hours to enter all my transactions into the free website Icarra.com. The result? I found that my grand efforts netted me maybe 2% better performance than the S&P 500 per year. That was not very much considering how much effort I was putting into managing my portfolio! I was also not confident that I could continue to outperform the market. Seeing my performance forced me to question whether I was putting too much effort into investing (about 20 hours per week or more following companies, reading books, and researching better ways to invest). That time was definitely hurting my performance in graduate school.

Just as an athlete would not fail to measure her performance, an investor must not fail to measure hers. Otherwise an investor will not know whether she is doing well or poorly. Icarra is free and easy to use. There are other ways to track performance, but most of them fail utterly. To accurately track performance you need to account for cash that is sitting in your brokerage account and you need to account for deposits and withdrawals from your brokerage account. Remember the Beardstown Ladies, an extremely profitable investment club from the mid-1990s? They “beat the market” and became famous. The only problem was that they failed to properly account for deposits they made to their brokerage account, such that they counted those deposits as profits. The Beardstown Ladies actually under-performed the S&P 500 by 1.9% per year from 1983 to 1997.

If you wish to see my performance, take a look at my long term longs portfolio on Icarra; the goal of this portfolio is just to offer market-like returns. See also my Roth Quant portfolio, which was traded using a quantitative trading strategy and is currently all in cash. On the other hand, I am a professional stock day-trader. I do not track these sorts of trades (90% of which are intra-day) online and I do not compare them to the market. There would be no reason for these trades to correlate with the stock market as I go both long and short; I track them in an Excel file and measure my success by total profit, profit margin, and other such metrics.

Once you start using Icarra (or a similar program / service), make sure you look at your Sharpe Ratio and Sortino Ratio (I prefer the Sortino). They are measurements of volatility-weighted performance relative to your benchmark (Icarra uses the T-bill return as the benchmark). Large positive numbers are good! Volatile portfolios are riskier than non-volatile portfolios, so these numbers give you a good idea of risk-adjusted portfolio performance.

I beseech thee now, go out and track thy performance!

The Data do not Lie, and if You Listen Closely You May Hear Their Glorious Song!

“How do I invest? How do I Trade?” These are questions I receive fairly often, as a fairly popular blogger (a couple hundred visitors per day at GoodeValue.com despite my infrequency of blogging) and a Top Fool on Motley Fool CAPS. The answer I give changes over time with my mood and as my opinions change. But the core of any good answer to that question is this: do what works. So be empirical! See what works in investing and then do it! Of course, such advice is almost too vague to be useful. But I find that most investors are not empirical at all. They use their gut, they go with hunches, they make decisions based only on a few pieces of evidence.

A simple empirical question, “what kinds of stocks outperform the market?” has a few different answers. Simply by asking the question we avoid the pitfalls of many investors who buy and sell randomly; as an example, my real estate agent bought shares in Arch Coal “because [he] saw so many trains going by, full of coal.” One variation of this question is as follows: What has been the best-performing class of stocks over the last 85 years? The answer is small value stocks. By far the best performers are microcap value stocks. They are highly volatile, risky, and illiquid. (See the great data behind the linked academic articles at Prof. Ken French’s website.) Of course, the articles I link are not the ‘truth’; it pays to check out contrary viewpoints and different data sets. For academic research on investing, search on SSRN; why not try searching a term such as ‘Motley Fool’ to start?

My arguments in favor of empiricism do not come at the expense of theory; I believe that any investing or trading strategy should have good theoretical underpinnings as well. Hence, we must ask ourselves: Why do value stocks outperform? Ken French and Eugene Fama, authors of the above-linked articles, argue that they are riskier. Higher returns are compensation for higher risk. Others, such as Joseph Piotroski, argue that the value premium does not reflect risk but rather a market failure. I believe that consistently illogical human thinking results in value stocks being consistently priced too low. (I thus fall into the behavioral finance camp.)

Why Do Things Happen? The Importance of Theory

Every year I see articles in the Wall Street Journal and other reputable financial news rags about the Superbowl indicator of the stock market. Supposedly if an NFC team wins, the stock market will go up that year. If an AFC team wins, the stock market will go down. Of course, there is no reasonable way the Superbowl could affect the stock market. Thus any investor who follows this indicator would be doing something very stupid.

Not every stock market indicator is as foolish and as theoretically vacuous as the Superbowl indicator, though; not all dumb theories are as easy to debunk. Take some popular technical indicators such as Gann Angles and Elliott Wave Principle, both of which posit that stock market prices follow certain mathematical rules. Neither of these technical analysis theories have behind them a plausible theory of why they should work. The hypothesis that Elliott Waves follow fundamental mathematical relationships found in nature is a non-explanation. You can find lots of things in nature that obey interesting mathematical rules (like the Fibonacci series), but it is impossible to predict a priori what will or will not follow such a series. Thus saying that something follows some mathematical rule describes but does not explain it.

Any theory should be testable and thus falsifiable (it should make predictions that can be proven wrong), and to quote one technical analyst, “The Elliott Wave Principle, as popularly practiced, is not a legitimate theory, but a story, and a compelling one that is eloquently told by Robert Prechter. The account is especially persuasive because EWP has the seemingly remarkable ability to fit any segment of market history down to its most minute fluctuations. I contend this is made possible by the method’s loosely defined rules and the ability to postulate a large number of nested waves of varying magnitude. This gives the Elliott analyst the same freedom and flexibility that allowed pre-Copernican astronomers to explain all observed planet movements even though their underlying theory of an Earth-centered universe was wrong.” (quote from Wikipedia article linked above.)

A person can legitimately criticize the vacuous theory behind a strategy while believing the strategy still works. Such is the case with me and some basic technical analysis chart patterns like head and shoulders and cup and handle patterns. Whatever theory originally attempted to explain them matters little to me. My theory is that they work because they are very popular and people believe them. They become a sort of self-fulfilling prophecy. Professor Carol Osler’s research has found that some basic chart patterns do work in foreign exchange markets. Conversely, one can find a theory behind a strategy to be plausible while finding that the strategy itself does not work. Such is the case with Dow Theory. Yet while the theory seems plausible (at least to me), a test of William Peter Hamilton’s early 20th century stock market prognostications using the theory was mixed, with Dow Theory underperforming the stock market in real terms but outperforming on a volatility-adjusted basis (it had a higher Sharpe ratio).

One last note on theory: the Dogs of the Dow is one of the most over-hyped, over-used useless investing strategies, with little theory behind it. The Motley Fool used to have a couple portfolios based on the Dogs of the Dow and they had even less theory backing them up.

What is the Null Hypothesis? What is the Default Investment?

In scientific endeavors we try to prove the new by showing that the data do not support the current way of thinking (the ‘null hypothesis’). In investing we need such a null hypothesis to form the default investment so that people do not invest randomly and risk losing lots of money (I have previously given thought to what the default investment should be). I will derive the default investment and then I will show why so few other investments make sense when compared to it.

Imagine that novice investors picked investments more or less randomly (which is pretty close to the truth). George invests in a corporate bond fund, Mary invests in biotech stocks, Clarissa invests in blue chips, and Thomas invests in sovereign debt. Add in a few million more neophyte investors and on average, these investors are buying the market of all investable assets. On average, these investors (through mutual funds and individually) own a portion of almost all the US corporate bonds, Treasury bonds , foreign corporate bonds, foreign government sovereign bonds, all United States and foreign stocks (except for the smallest foreign stocks), and much investment real estate in developed countries. This group as a whole will do as well as the market as a whole (all bonds + investment real estate + stocks). Most of these investors are poorly diversified: stock investors often own just a couple stocks; mutual fund investors are often not diversified across asset classes, many holding almost all stocks, some holding all bonds. Because these investors have so little diversification, they will tend to do either much better or much worse than the market. The variance in outcomes will be high. Even worse, the high variance in outcomes will likely lead those with poor outcomes to avoid risky assets and those with good outcomes to over-trade, believing they are investing geniuses rather than just lucky. The default investment should simply be what the average individual investor already holds: a wide variety of stocks, bonds, and real estate from throughout the world. This can easily be done with the purchase of a few low-fee index funds.

The Market is Efficient and It Does Not Care if You Agree

When most people hear an explanation of the efficient market hypothesis (EMH) they instinctively reject the concept. “What?! Of course if you are smart and do good research you can beat the market. Just look at Peter Lynch / Warren Buffet / me!” (Of course, I could reply, “Look at how mutual fund managers generally underperform the market and how there is little evidence they exhibit skill and how after taxes active mutual fund and hedge fund investors generally lose to index fund investors.”) Try to hold back your instinctive dislike of such a concept as I explain why the market is efficient even if the EMH is not completely correct.

There are a large number of very smart people doing a lot of work to try to determine the correct prices for stocks and bonds. These people are highly motivated and often make lots of money. If they find an undervalued stock or bond they buy it, pushing up the price and profiting from the increase in value. If they find an overvalued stock they short sell it (or if there is an overvalued bond they buy credit default swaps on it) and cause its price to decrease a little. The more undervalued / overvalued a stock or bond is, the more investors will flock to trade it and the quicker it will return to a reasonable estimation of its fair value. This does not mean that stocks and bonds will always be accurately priced. It does mean that it is very rare for a security to be very inaccurately priced.

Take a look at how the market deals with news. When Roche recently upped its bid for Genentech (DNA) from $93 to $95, the stock price did not increase. It had already increased by about $2 per share a few minutes after a Dow Jones Newswires report came out days earlier saying that there were rumors that Roche would raise its bid. Similarly, when an analyst increases his price target or rating for a stock it will tend to jump immediately. Price moves based on news are almost instantaneous and are not very profitable even for the hedge funds with computer programs that trade based on news stories milliseconds after they hit the newswires.

Even “soft news” such as blog posts can quickly affect the price of a stock. When I put out a scathing blog post on H2Diesel (now New Generation Biofuels, NGBF) back when it was traded on the dreadful OTC BB (which is not a very efficient market and is overpriced on average because of difficulties in short selling), within five days the stock price had dropped 40% (see chart: my blog post came out on 10/12/2007 and it was syndicated on Seeking Alpha on 10/15/2007). (I should note that unfortunately I did not short sell this stock even though I could have done so; my capital was tied up elsewhere.)

In a fairly efficient market where many smart investors fight over tiny scraps of information and do thorough research to try to gain an upper hand and outperform the market, an investor cannot profit from publicly known information unless other investors fail to appreciate the importance of such information. What this means is that any investor who thinks that they can beat the market with some stock pick is betting that every other current buyer and seller of that stock does not understand something fundamental about that company. Any decision to pick stocks, actively trade, or time the market is a big bet that everyone else is wrong. Investors should not make such hubristic decisions lightly. There are three things that might validly convince an investor to try to beat the market: know something no one else knows, know something everyone else knows but does not understand, or know something that no one else can act upon.

Know What No One Else Knows

The easiest way to profit from this is to acquire inside information. It worked for Ivan Boesky (his story is told in the excellent book Den of Thieves) and it can work for you! This is obviously illegal. A legal way to do this is to make investments based on what insiders are doing (Does that work and does that make sense? Remember, these are the questions you should always ask yourself. Yes and yes, according to reams of research and a good book, Investment Intelligence from Insider Trading by Nejut Seyhun). Another way is to do what analysts are supposed to do: talk to suppliers, industry contacts, customers, management, and check out stores so that you understand the company better than anyone other than the company’s management. While this can work, it is an impossibly large amount of work for any non-professional, and even the best stock analysts do not have enviable track records.

An example of this would have been how I knew before almost all other investors about the acute shortage of acetonitrile—I am married to a chemist and have friends working at many large chemical and pharmaceutical companies; this gives me access to lots of chemical-industry information, and as long as it is not specific to a particular company, trading on it would not be illegal. If I felt that the information was actionable, I could easily have bought stock in Sigma-Aldrich (SIAL), one of the largest distributors of acetonitrile (which is a by-product of the manufacture of certain plastics, most often used in cars), long before anyone heard of the problem. Unfortunately, the shortage is not actionable because it does not benefit Sigma-Aldrich or any other company and most companies affected by it can cope and are thus not short candidates.

Another way to know what no one else (or at least very few people) know is to concentrate on the smallest and least-followed companies. I made plenty of money over the last year and a half by doing in-depth research of sketchy penny stock companies and then short selling their stocks. As an example, take a look at my early blog posts on Continental Fuels (now CNFU.ob, formerly CFUL.ob). The company’s capital structure and market capitalization was so obscured by complicated convertible stock deals that I doubted any of the investors understood just how badly overvalued the company was. (This also falls under the rubrics of “know something everyone else knows but does not understand”–because the investors in such companies are usually idiots–and “know something that no one else can act upon”—because it is very difficult to short sell OTC BB stocks).

Know Something Everyone Else Knows but No One Understands

This is the investing method that everyone thinks they can do but almost none can. A great example of this is the story of John McQuown (who later helped to develop the first index fund while at Wells Fargo; this story and others of the rise of modern finance are described in Peter Bernstein’s excellent book Capital Ideas). A mechanical engineer, he borrowed $1600 against his Chevy convertible in 1957 to buy 400 shares of Texas Instruments (TXN). He believed that the invention of the transistor would revolutionize all electronics and TI would benefit. He was right. He liquidated his investment two years later for $180,000 (112 times his original investment!). Unfortunately he let it get to his head and in three more years he had lost all the money he had made in that trade.

I myself have made some small profits by understanding earlier than many how bad the housing crash was going to be. I used my understanding of the situation to profitably short sell some banks that had huge construction loans outstanding. Others saw the housing collapse and credit crunch earlier or more clearly and made fortunes (John Paulson comes to mind). A few years ago an insightful investor could have made a killing by understanding how powerful Google’s (GOOG) technology was (and how incompetent Yahoo and Microsoft would be in response) or how good Steve Jobs’ ideas and designs would be at Apple (AAPL).

One problem with this way of beating the market is that it requires the investor to be smarter / wiser than almost everyone else. The investor also has to be lucky as to timing. It was a no-brainer that internet stocks were overvalued in 1997. Plenty of people went broke shorting them for the next two years. Calling the top required luck as well as skill. Relying upon luck is a very poor strategy. Even ignoring the question of timing, it is very hard to be consistently wiser than every other investor. Many who try make a few good calls and then make a ton of very bad calls (like John McQuown above).

The other problem with this strategy is that everybody understands the big themes. Everyone knew Google would be wildly successful when it went public. Its P/E was in the stratosphere. The harder question was whether the stock already priced in the growth the company would achieve. Everyone knew that computers would change everything in the early 1980s. That was true. Microsoft (MSFT) and Apple (AAPL) would have made stellar investments. Yet that did no good for investors in public companies that went bankrupt such as Miniscribe, Syquest, Tandy, Wang Laboratories (which was one of the hottest stocks of the time and had 27,000 employees), and many others. The same thing happened during the Tronix boom of the late 50s, the railroad booms in the 19th century, and the dot-com boom of the late 1990s: while huge changes occurred and many got rich off them, many more investors lost money investing in the companies that failed. For every Microsoft there is an Iomega. For every Cisco (CSCO) there are a Nortel and a Lucent (ALU) and a Motorola (MOT).


Know Something That No One Else Can Act Upon

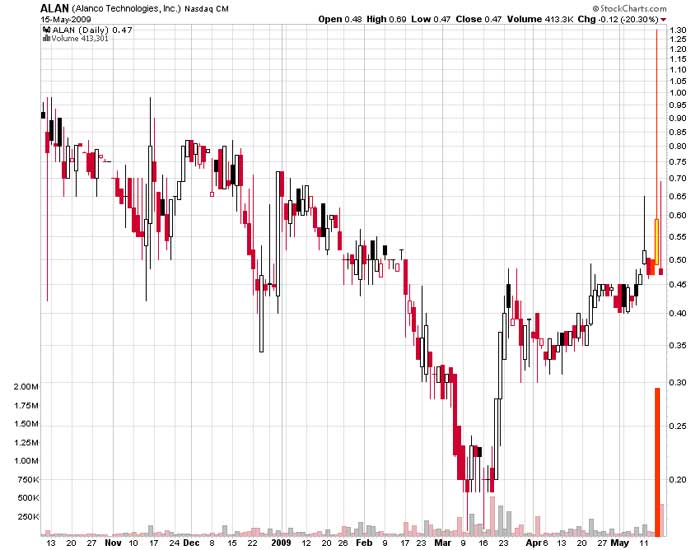
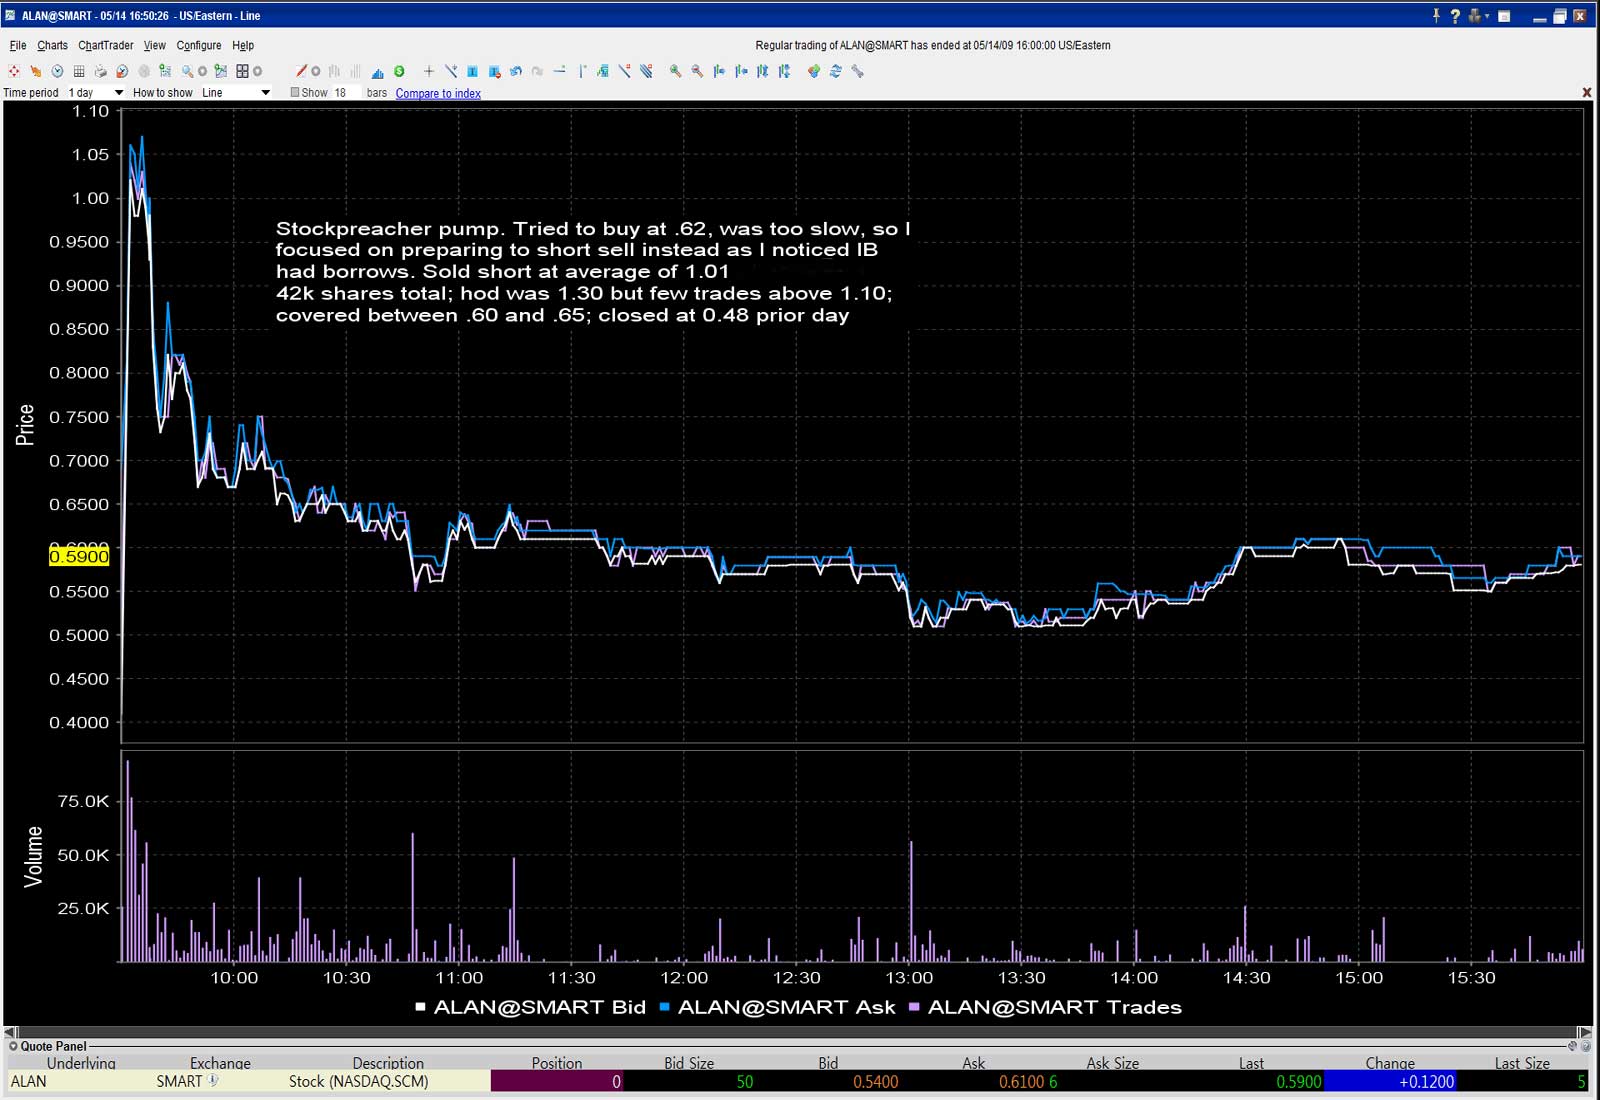
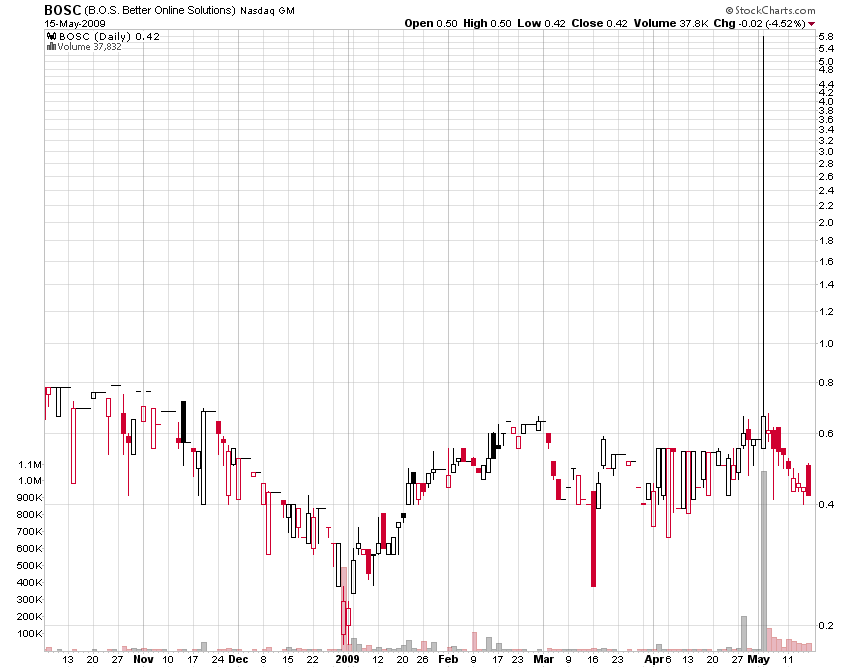
Perhaps the best example of knowing something that no one else can act upon is one of my best day-trading strategies. I look for low-priced stocks that go up 40% or more in under a minute. I then short sell them. No one but a few other day traders will touch these stocks for a few reasons: they are illiquid, these patterns play out very quickly (within a minute or two), and very few traders have the right tools to identify such stocks. I blogged about a recent such stock that gained 1000% in minutes and lost it almost as quickly. Remember my criteria for a good investment or trading strategy above? Any good strategy should be empirically supported (as this strategy is: I have made a couple dozen such trades and they have been highly net profitable and over 80% of individual trades have been profitable) and theoretically valid. My theory for why this trading strategy works is simple: the only reason for such huge moves in these stocks is that a trader accidentally places a larger order than desired (say, buying 10,000 shares instead of 1,000) or accidentally places a market order instead of a limit order.

Another example of knowing something that no one else can act upon is the use of arbitrage strategies last October and November and even now. The market meltdown killed arbitrage traders, who are often highly leveraged. This made possible plenty of easy trades such as arbitraging KV Therapeutics (motto: “Oops, we might have contaminated the drugs we’ve been selling! Sorry.”) by going long KV-A and short KV-B (I did this after the B shares doubled and the A shares did not move). In Mueller Water, going long MWA-B short MWA could have netted an arbitrageur an unleveraged 30% back in November (the company recently converted all the B shares into A shares). A similar arbitrage in Blockbuster (BBI & BBI-B) would have been very profitable. The key to profit from this type of strategy is to find a market where the normal buyers cannot buy for some reason and then look for bargains. Many believe that mortgage-backed securities (MBS) offer such opportunities now; even good ones are trading at very low levels. Of course, there are also many MBS that are worth $0.

Interim Conclusions: Data & Theory Good … but Problems Lurk

I have hopefully shown why any investment philosophy should be both proven by historical data and theoretically sound. But in the messy, uncertain world of human behavior we cannot just observe that something happened in the past and know that the same thing will happen in the future. Unlike with chemistry, where mixing potassium metal and water will always lead to fun things, the observations and actions of investors will change how the stock market acts over time. George Soros has coined the term “reflexivity” to refer to this. Soros said, “The theory holds, in the most general terms, that the way philosophy and natural science have taught us to look at the world is basically inappropriate when we are considering events which have thinking participants.”

Besides the problem of reflexivity there are also statistical problems and practical problems to those seeking to ‘beat the market.’ This article grows long, however, and my wrists grow weak. A guide to the problems facing any practitioner of evidence-based investing and examples of such problems will be coming in Parts 2 & 3 of this series.

Disclaimer: No positions in any stocks mentioned. This blog has a terms of use that is incorporated by reference into this post; you can find all my disclaimers and disclosures there as well..

The trader’s guide to the uptick rule

This post was originally published on my GoodeValue.com blog on 5/3/2009. Due to blog moves it was not correctly moved to this blog so I have reposted it. 

In the wake of the stock market rout of 2008, the SEC is considering reinstating the uptick rule [pdf] or some variation thereof and the SEC has asked for comments from market participants (see the submitted comments). Having researched the question thoroughly (as a short seller it behooves me to be prepared for any such changes), I found that while there has been some good research on the effects of the uptick rule, there is little information in the press and most of the bloggers and journalists who have written about the uptick rule have given biased or incomplete accounts of what the uptick rule is and how it has affected markets. This post is an attempt to correct the misinformation. In addition to reading this article, I encourage you to download and read the original research that I cite in forming your own opinion on the uptick rule.

A History of Stock Market Manipulation

While bear raids are legend on Wall Street, there is much less evidence of bearish stock price manipulation than there is of bullish manipulation, even back in the wild days before there was much stock market regulation. So while tens millions of dollars of illicit profits are made each year in pump and dump schemes there have only been a couple of ‘short and distort’ schemes prosecuted in the last couple decades (in fact, of the two cases of which I am aware, Anthony Elgindy’s case involved no distortion; his crime was conspiring with FBI agents to gain information on companies actually being investigated by the FBI).

For some information on stock market manipulation back in the early 1900s I suggest reading Edwin Lefevre’s Reminiscences of a Stock Operator. Allen’s article Stock price manipulation [pdf] also has a few interesting tales, including the story of how members of the City Council of New York conspired to manipulate the stock price of the Harlem Rail company but were outsmarted by Cornelius Vanderbilt. While there is little evidence of manipulation on the part of short sellers, there is plenty of evidence of manipulation by longs to squeeze short sellers. A recent example is how Porsche cornered the stock of Volkswagen in October 2008 without anyone knowing, causing a huge short squeeze (which could not have happened in the United States due to the requirement that large stockholders disclose trades in 13d or 13f filings; for background on past stock corners see this NY Times article from 1989 and the follow-up article).

A Brief History of the Uptick Rule

In response to the stock market crash in late October 1929, the US Senate formed the Pecora Commission, which revealed many problems with banks and led directly to the Glass-Steagall act and the Securities acts of 1933 (which required that securities be registered) and 1934 (which formed the SEC to regulate stock exchanges). Short sellers were often blamed in the media and by politicians for the stock market crash. In response to this, the NYSE collected data on short interest, which was only at 0.15% of outstanding shares on November 12, 1929, compared to 2.3% on September 13, 2002 (Jones, Shorting restrictions, liquidity, and returns [pdf]).

Opponents of short selling continued to call for measures to restrict the practice or ban it outright. To prevent politicians from completely banning short selling, the NYSE ruled on October 6, 1931 that short selling on a downtick was ‘demoralizing’, thus banning the practice as demoralizing trades were already prohibited. Interest in restricting short selling continued among politicians and on April 1, 1932, a new rule went into effect that required written authorization for brokers to borrow customers’ stock to lend to short sellers. While this caused a temporary short squeeze, Wall Street has adapted, and now most brokerages’ margin account documents grant the brokerage the right to borrow all securities held in the account without payment of interest (a broker cannot borrow stock from a cash account).

Starting on February 8, 1938 short selling was restricted even further when the SEC ruled that short sells could take place only on a strict uptick (at a higher price than the previous transaction); this applied to all exchange-listed stocks, including the regional stock exchanges. This greatly restricted short selling; because it was so restrictive the SEC amended the rule to allow short selling on upticks or zero-plus ticks (this rule went into effect on March 20, 1939); the uptick rule was not changed after this point until Reg SHO came along in the early 2000s. Before addressing recent research on the effects of the uptick rule, we must take a detour to the Nasdaq (formerly an acronym, NASDAQ), which was not a stock exchange prior to August 1, 2006. It was simply the National Association of Securities Dealers Automated Quotation system for OTC securities (SEC OEA, Economic Analysis of Short Sale Price Restrictions [pdf]). Nasdaq stocks were thus not subject to the uptick rule.

In 1994, the NASD introduced a bid test for Nasdaq National Market stocks (not the smaller companies listed on the Nasdaq SmallCap Market), which required short sales of Nasdaq stocks to be above the best bid if the bid is lower than the previous best bid. This is less restrictive than the uptick rule. Furthermore, the bid test was never instituted by certain popular ECNs, including Inet and Arca; this made it easy for short sellers to avoid the bid test (Diether, Lee, & Werner, It’s SHO Time! [pdf]). So if short sellers who have primarily traded Nasdaq stocks think the uptick rule will not affect them because they had no problems in the past, they are wrong; the SEC has indicated that whatever rule it promulgates will apply to Nasdaq as well as NYSE and Amex stocks and to all the ECNs.

Non-Experimental Research on the Uptick Rule

The uptick rule prevents short sellers from hitting the bid most of the time and requires them to use limit orders above the best bid. This causes short sellers to achieve better prices than they would absent the uptick rule (because their limit orders are on average executed above the midpoint of bid and offer), but conversely many short sale orders are never filled and those that do fill take more time to fill than they would absent the uptick rule (Alexander & Peterson, Short Selling on the NYSE and the Effects of the Uptick Rule [pdf]). In fact, the uptick rule was found to delay or prevent the execution of over 90% of short sale orders on the NYSE. The lack of a bid test for NasdaqSC stocks while NasdaqNM stocks had a bid test allowed Ferri, Christophe, and Angel (A short look at bear raids Testing the bid test [pdf]) to examine the effects of the bid test on the tech bust of 2000-2001.

They found that there was less short selling in the NasdaqSC stocks than in the NasdaqNM stocks and that highly-shorted NasdaqSC stocks did not suffer a greater frequency of stock price crashes than similar NasdaqNM stocks. These conclusions are not very useful in the uptick/upbid rule debate, considering the weakness of the bid test and the ease with which it could be avoided. One intriguing finding from the study is that in every instance (out of thirteen) where a Nasdaq stock fell by over 10% in one day and over 20% of the sales that day were short sales, bad news such as a poor earnings report (and not rumors or a bear raid) explained the stock price decline. In the debate over the uptick rule, it is important to remember that tick size affects the restrictiveness of any uptick or upbid rule. After tick sizes were reduced from 1/8 dollar to 1/16 dollar in 1997, short sales became easier and executions faster (Alexander & Peterson, Implications of a reduction in tick size on short-sell order execution [pdf]). With decimalization in early 2001 the uptick and upbid rules became even less effective.

Reg SHO & The Great Experiment

Reg SHO (short for Regulation on Short Selling or Regulation Short; those SEC folks are creative!), besides changing the rules regarding naked short selling (which is beyond the purview of this article) established an experiment wherein from May 2, 2005 to August 5, 2007 one-third of all the stocks in the Russell 3000 index were exempted from the uptick and upbid rules. Detailed tick-level data (with short sales identified by the exchanges) was collected on all the stocks, with the 2000 stocks for which the bid or tick test was not removed serving as controls for the pilot group of stocks that had the rules lifted. The SEC Office of Economic Analysis analyzed the data and made it available to other economists as well. The outside economists and the SEC used varying methodologies to analyze the data; due to the number of different analyses conducted I will not describe them in detail, referring the interested reader instead to the SEC OEA report [pdf] for a good discussion of all the analyses. I provide only summaries of the results below.

The researchers were interested in the effect of the uptick/upbid tests on liquidity, volatility, the prevalence of ‘bear raids’, stock returns, and short interest. Generally speaking, different researchers reached similar conclusions. All researchers found that differences between uptick-test and non-uptick-test stocks were greater than between bid-test and non-bid-test stocks; for that reason when I will discuss only the uptick test stocks below. Multiple studies found that short-term (5-minute level) volatility increased significantly in pilot stocks, as would be expected, because short sellers could demand liquidity rather than supplying it. This increased the likelihood of small downward moves as short sellers hit the bid, exhausting all the orders at the best bid, then filling at the new lower best bid; conversely, upward volatility increased because large buyers were more likely to exhaust the best offer and drive the price higher without short sellers’ limit orders there. In fact, control stocks, because short sellers were forced to offer liquidity, had 10% greater liquidity on the offer than on the bid; this imbalance was corrected once the uptick rule was removed and test stocks thus had more balanced bid/offer liquidity (Diether, Lee, & Werner, It’s SHO Time! [pdf]).

Longer-term volatility (at the 30-minute level or longer) did not increase in pilot stocks. As to stock returns, the SEC study found no significant difference in returns over the first 6 months of the Reg SHO study. A more recent study of the same data by Harmon and Bar-Yam of the New England Complex Systems Institute or NECSI (Technical Report on SEC Uptick Repeal Pilot [pdf]) came to a different conclusion using different statistical methods. They found that pilot stocks–both Nasdaq and NYSE stocks– fell significantly relative to control stocks. I disagree with many of the methods they used, inlcuding fitting to a normal distribution and trimming outliers (with long-term stock returns having very fat tails–Mandlebrot has argued they are best described by the Cauchy distribution rather than a normal distribution–both those methods are inappropriate).*

The more important problem with their finding is that pilot Nasdaq stocks fell by 2.09% relative to control stocks, while pilot NYSE stocks fell by 2.38% relative to control stocks. As I described above, the Nasdaq bid test was generally ineffective and it could easily be avoided by sending orders to ECNs. Therefore, similarly negative adjusted returns for both NYSE and Nasdaq stocks seems likely to be a spurious finding. Furthermore, even if this finding were robust, it could indicate either that stocks in general were overvalued due to the uptick/upbid rules or that they became undervalued when the uptick/upbid rules were removed. I must wonder why the NECSI researchers did not compute the stock return data for the rest of the Reg SHO pilot period, instead sticking to the data from the first 6 months that was used by the SEC. As to bear raids, different researchers searched for them in different ways. Some used variance and semi-variance. These measures capture normal volatility more so than extreme events like bear raids.

Alexander and Peterson ((How) do price tests affect short selling [pdf]) also compare the daily price change (known to stock traders as the average daily range or ADR; this is the day’s high minus the day’s low) of pilot and control stocks, finding no differences. They also looked at price runs following a short sale, a much more powerful method of identifying bear raids. There was no tendency for there to be runs of more than two short sales executing at lower prices in pilot stocks relative to control stocks, on either the NYSE or the Nasdaq. The SEC study found no increase in short interest or put option open interest in pilot stocks. While there were more short sales in pilot stocks, the increase in short sales was explained by a decreasing size in short sales. Because short sellers did not have to worry about the uptick rule preventing them from selling quickly, they were more likely to split up larger orders to disguise their true size (just as large buyers do).

Conclusions & Caveats

The conclusion of all the economists whom I have cited above or listed in my bibliography below, as well as the SEC’s Office of Economic Analysis, is that the uptick rule does not fulfill its goal of preventing bear raids while allowing short sellers to sell into rising markets. Rather, there remains little evidence of bear raids, while the uptick rule restricts short selling even when a stock is rising. I recommend reading the transcript of the SEC’s roundtable discussion on the results [pdf] to see the opinions of the relevant people. There are a couple caveats to the Reg SHO pilot study. It took place as stock markets were generally rising and volatility was low. If bear raids do exist, it is likely that they would be more prevalent during bear markets when confidence is low and investors are more easily scared. None of the above studies can address whether bear raids have taken place over the last year.

Recommendations

I am of course against reinstating the uptick rule. It is a poor rule that restricts all short selling (even though speculative short selling is a less common use of short selling than are arbitrage, hedging, and market neutral strategies) and if the SEC really wishes to prevent bear raids, it would make more sense to use some sort of individual stock circuit breaker, such as the one proposed by the major US stock exchanges that would institute a bid test only after a stock has fallen by a certain percentage, such as 10%. Such a rule would allow most short selling while restricting it when a stock is falling precipitously. Furthermore, a circuit breaker that automatically halts trading in a stock for 30 minutes following a huge drop or spike (say 20%) would be a good addition to the rule proposed by the stock exchanges.

Bibliography

SEC spotlight on short sales SEC OEA: Economic Analysis of the Short Sale Price Restrictions Under the Regulation SHO Pilot [pdf]
Transcript of the SEC Roundtable on the Regulation SHO Pilot [pdf]
A short look at bear raids Testing the bid test [pdf]
(How) do price tests affect short selling [pdf]
Implications of a reduction in tick size on short-sell order execution [pdf]
Its SHO time! Short-Sale Price Tests and Market Quality [pdf]
Limited arbitrage and short sales restrictions: evidence from the options markets [pdf] Market bubbles and wasteful avoidance: tax and regulatory constraints on short sales [pdf] Nibbling at the Edges – Regulation of Short Selling Short Selling on the New York Stock Exchange and the Effects of the Uptick Rule [pdf]
Shorting restrictions, liquidity, and returns [pdf]
Short-Sale Constraints Good or Bad News for the Stock Market [pdf]
Stock price manipulation [pdf]
The uptick rule of short sale regulation (This paper examines the rate of decline of Reg SHO pilot and control stocks following negative earnings reports and finds no difference) Short selling and the informational efficiency of prices Technical Report on SEC Uptick Repeal Pilot [pdf]

Disclosure: I am a full-time stock trader who primarily sells short. This blog has a terms of use that is incorporated by reference into this post; you can find all my disclaimers and disclosures there as well..

*I should also mention that combining the NYSE and Nasdaq stock data (one of the other methods used by the NECSI researchers) is also innappropriate, given the facts I outlined above after the asterisk (I apologize for making the reader jump around). The one method the researchers used that was legitimate was using non-market-adjusted data. In general, I have to say that I was unimpressed with the NECSI report. It is obvious that the authors are not social scientists and are thus unfamiliar with certain difficulties inherent in social science research. Their other main analysis compared the number of large stock drops in 2000 and 2001 to those in 2007 and 2008. It is not appropriate to compare stock returns during a mild recession and the bursting of a bubble in a small subset of stocks and a period during which most large financial companies require government support to stay afloat and GDP in many countries decreases at rates not seen since the Great Depression as every single stock sector got pummeled.

How the uptick rule abetted illegal bear raids

This post was originally published on my GoodeValue.com blog on 5/12/2009. Due to blog moves it was not correctly moved to this blog so I have reposted it. 

The SEC Enforcement Division just put out a press release announcing a judgment against a stock trader who conspired with a brokerage CEO and another trader to evade the uptick rule and profit from manipulative short selling, creating ‘bear raids’. See the original SEC complaint [pdf] against Robert Todd Beardsley and his partner George Lindenberg for details (all the quotes that follow come from that document). The two used multiple accounts to attack various stocks with a concentrated barrage of short sales with the aim of quickly driving the stock price down. Beardsley even “utilized the identities of two foreign individuals to open additional Redwood [brokerage] accounts” in an attempt to cover up the scheme. The two violated the law by failing to observe the uptick rule (their short sales were all in NYSE stocks), by failing to properly mark their orders as short sales, and by trading with the intent to manipulate stock prices.

They made total profits of “approximately $2,400,000.” Evidently both men spent the money quickly, because by the time the SEC obtained judgments against them, both had few assets left and as a result Beardsley only had to pay $100,000 and Lindenberg had to pay $65,000. Now for the interesting part of the story. The duo’s illegal profits were possible only because of the uptick rule. Under the uptick rule, market short sale orders often could not be immediately executed. Those orders would pile up, waiting for an uptick. Market makers and those with special software (as Beardsley and Lindenberg had) could see those unfilled market short sale orders. The duo “looked for stocks where a large market sell order was waiting to be executed, which they surmised was a short sale order”; they would then quickly drive a stock down with short sales and then create an uptick to cover their whole position at a price that was often “one cent higher than their last sale.”

In one instance, they sold short 16,485 shares of Tesoro at prices ranging from $17.82 to $17.51; they covered the whole position at $17.52, covering into a market short sale order that could finally be executed. In this manner Beardsley and Lindenberg made about $2,000; they repeated this procedure throughout the day and their profits quickly piled up. This is the first solid evidence I have ever seen of an actual bear raid. Of course, this bear raid was made possible only by the existence of the uptick rule. Furthermore, the market participants who were most harmed by it were the hapless short sellers whose market short sale orders were executed at depressed prices. As to the so-called bear raids that supposedly occur because the uptick rule has been removed, I continue to doubt their existence. Without the kind of advance knowledge of big sell orders that Beardsley and Lindenberg had, it would be very unlikely for a bear raid to be profitable, as the buy orders to cover the short position would drive the stock back up as quickly as it fell.

Further Reading
SEC Press Release regarding Beardsley judgment
SEC Complaint against Beardsley & Lindenberg [pdf]
Final Judgment against Lindenberg [pdf]
Final Judgment against Beardsley [pdf]
The Trader’s Guide to the Uptick Rule

Disclaimer: No positions in any stocks mentioned. This blog has a terms of use that is incorporated by reference into this post; you can find all my disclaimers and disclosures there as well..

How I stopped StockPreacher’s Alanco bull raid

This post was originally published on my GoodeValue.com blog on 5/16/2009. Due to blog moves it was not correctly moved to this blog so I have reposted it. 

A lot can be said about short sellers.  One undeniable fact is that short sellers are the sellers of last resort. When everyone else wants to buy, the only ones who wish to sell are often short sellers. In fact, while many fear the depredations of short sellers manipulating the market with bear raids (of which there is little evidence), short sellers are the ones who protect the market from pump & dump schemes and bull raids (a bull raid being a concerted promotion of a stock when the promoter is not being compensated; certain stock pumpers will engage in these from time to time to enhance their credibility). It is worth noting that pump & dump schemes are common in OTC and Pinksheets stocks that usually trade for less than a dime per share, but there are almost none in higher-priced listed stocks. The reason for this is that margin rules and difficulties borrowing shares to short prevent short sellers from being the sellers of last resort for penny stocks. For listed securities they are more easily able to sell. It is the fear of short sellers that causes most stock pumpers to avoid stocks trading for over $1 per share on exchanges like the NYSE and Nasdaq.

Sometimes pumpers get a little cocky or a short seller gets lucky and a pump & dump runs headlong into the brick wall that is a motivated and well-funded short seller. Whatever the reason, this short seller was able to find plenty of shares to borrow of last Thursday’s pump of Alanco Technologies (ALAN). This pump (or in this case a bull raid, as the pumper reported having received no money to promote the company) came from stock tout Stockpreacher (about which I have written previously). Stockpreacher released its ‘report’ on the company just as the market opened and ALAN jumped 100% from an opening price of $0.49 to over $1.00 in less than a minute (this was no doubt caused by Stockpreacher’s idiot subscribers buying with market orders). The stock touched a high of $1.30 but very few shares traded hands above $1.05.

ALAN Daily Stock Chart (pump and dump day highlighted; click to enlarge)

Seeing that the stock was up an insane amount for no reason other than a bull raid and that there were shares available to short, I quickly started selling large blocks of shares. I knew that the only reason the stock was up was a bull raid and I knew from past experience that previous Stockpreacher bull raids dropped quickly from their highs. I quickly exhausted all 12,550 shares of ALAN available to short at my main brokerage, Interactive Brokers (see a screen shot of my trades there). I then moved on to another brokerage account that had shares available and sold short another 34,500 shares. I had an average short price of $1.01. My fusillade of short sales (I sold over 2% of that day’s volume in the span of a couple minutes) helped to keep the stock from hitting more outrageous highs than the already outrageous $1.30 it briefly hit. How do I know? Stockpreacher’s bull raid on BOSC from the previous week (for which no shares were available to short at any of my four brokerages) had driven the stock price from $0.60 to an intra-day high of $5.80.

ALAN Intraday Stock Chart (click image to enlarge)

About an hour and fifteen minutes after I first sold short, I covered my short position at prices between $0.60 and $0.65. I netted $17,322 for a few minutes’ work and I got the satisfaction of helping to counter the manipulation of a notorious stock tout. It was indeed a good day.

How You Can Profit from Pump & Dumps

Some fellow stock traders were impressed with my courage in short selling a stock that was up 100% on manipulation without even waiting for the buying pressure to ease up. My response  was simple: manipulation has its limits. I am now nearly an expert on manipulation and hype, having learned from Tim Sykes how to short sell manipulated stocks.  I knew from observing the previous Stockpreacher bull raids that the stocks always dropped quickly from their intraday highs. There are no easier trades than short selling a stock that has been manipulated 100% higher when you know the manipulation is going to cease (Stockpreacher does not keep pumping the stocks it selects for bull raids after the initial day). That being said, it is scary to quickly take a large short position in a volatile stock. To do so requires both understanding hype and manipulation and confidence in being right. Unfortunately, until the last couple weeks (during which I have made several great trades), my confidence has been poor (like my trading) this year.

As I have mentioned repeatedly in my articles on becoming a stock trader (Part 1Part 2) and in my Introduction to Evidence-Based Investing, the bane of any trader (or investor) is emotion. Fear and greed are both anathema to successful trading; a trader should be confident but not overconfident. Trading involves implementation of a specific plan; emotion will distract from the plan and lead to poor decisions. I have struggled with my trading this year, suffering from a large draw-down in my secret super-awesome trading strategy, suffering from meager profits in my pennystocking trading strategy (Tim Sykes’ strategy), and even messing up my arbitrage trades.

As a result of the above troubles, my account dipped into negative territory and I was feeling horrible. While I gained 5.13% in January and gained 5.32% in February, I lost 3.81% in March and lost 9.90% in April. I resolved to dial down my risk a bit and focus on fixing my trading errors. I revised my super-secret trading strategy (which had been responsible for 80% of my profits and losses) in a way that only slightly reduces returns while greatly reducing risk. For my pennystocking trades, I focused on getting my confidence back. The best way to do that is to focus on the easiest trades. So, knowing how easy it would be to profit from short selling a Stockpreacher pump, I followed each one and did not let my fears keep me from taking a huge short position in ALAN. It helped that I follow Tim Sykes and he kept reiterating the ease of profiting from stocks up on hype alone. That strategy seems to be working as I am now up 12.14% so far this month (and May is only half-over!).

Now I have my confidence back and will look to improve my performance in more difficult trades. Of course, there is no reason for me to abandon the easiest trades! If possible, I will gladly sell short 100,000 shares of the next Stockpreacher pump!

Disclaimer: No positions in any stocks mentioned. This blog has a terms of use that is incorporated by reference into this post; you can find all my disclaimers and disclosures there as well..

Blog update

Yesterday, on Thursday, February 22nd, a couple subscribers alerted me to the fact that my ReaperTrades.com blog and GoodeTrades.com blogs had been infected with the iframe malware/virus. If you visited either website over the last few days or week I suggest running a full virus scan as well as spyware/malware scan (Malwarebytes and Spybot Search & Destroy are both recommended). I also recommend clearing your browser’s cache. The infection was almost certainly due to a WordPress plug-in that I had not updated (my personal computer was not infected).

I have completely wiped the infected WordPress install and have installed a fresh version that I am now working on hardening to prevent any future problems. So far I have taken most of the steps to enhance security recommended by WordPress.

Also, my old blogs, GoodeValue.com and Reapertrades.com, have been taken down permanently and all their content will redirect to this blog (the posts have been mirrored on this blog).