The Great Seadrill trade I missed and the OCC

First, because I cannot resist — just replace “OPP” with “OCC” when you sing along.


I’m not down with OPP. But I am down with The OCC (The Options Clearing Corporation). They are the ones who determine settlement and other important technical details of traded options. For most options traders, The OCC is unimportant — each option has a strike price and an expiry date and that is all that really matters. But when there are corporate events such as mergers, splits, bankruptcies, and the like, the OCC’s decisions become important.

Seadrill Inc (SDRL) just emerged today from its long trip through bankruptcy. From the company’s press release:

SDRL – Seadrill Announces Emergence from Chapter 11

Hamilton, Bermuda, July 2, 2018 – Seadrill Limited (“Seadrill” or the “Company“) announces today (the “Effective Date“) that it has emerged from chapter 11 after successfully completing its reorganization pursuant to its chapter 11 plan of reorganization (the “Plan“). All conditions precedent to the restructuring contemplated by the Plan have been satisfied or otherwise waived.

The Plan has equitized approximately $2.4 billion in unsecured bond obligations, more than $1 billion in contingent newbuild obligations, substantial unliquidated guaranty obligations, and c. $250 million in unsecured interest rate and currency swap claims, while extending near term debt maturities, providing the Company with over $1 billion in fresh capital and leaving employee, customer, and ordinary trade claims largely unimpaired.

The Plan has re-profiled the Company’s debt and provided substantial liquidity that puts the Company in a strong position to execute its business plan. The figures presented below highlight key financial metrics as of the Effective Date:

  • total cash of c.$2.1 billion;
  • secured bank debt of c.$5.7 billion with the first maturity in 2022;
  • new Secured Notes of c.$880 million maturing in 2025;
  • backlog of c.$2.3 billion for Seadrill Limited, excluding Seamex and Seadrill Partners; and
  • common shares issued of 100 million as described further below.

Issuance, Listing and Trading of New Common Stock

The Company has received approval to list its new common shares with the new CUSIP number G7998G 106 (the “New Common Shares“) on the New York Stock Exchange (the “NYSE“) under the same NYSE ticker symbol “SDRL” as the Company’s existing common shares (with the CUSIP G7945E 105) (the “Existing Shares“).  Subject to the relevant approvals, the Company also intends to have its equity listed on the Oslo Stock Exchange (ISIN BMG7998G1069).

On the Effective Date, the Company will have approximately 100 million New Common Shares outstanding.  The New Common Shares will be allocated as set forth below, in accordance with provisions of the Plan and issued on the Effective Date:

  • 14.25% of the New Common Shares issued to holders of unsecured claims against the Company and certain of its chapter 11 debtor affiliates;
  • 23.75% of the New Common Shares issued to participants in the $200 million equity investment under the Plan;
  • 54.625% of the New Common Shares issued to participants in the $880 million new secured notes investment under the Plan;
  • 1.9% of the New Common Shares issued to holders of existing common equity interest in the Company as of the Effective Date, an effective exchange ratio of approximately 0.0037345 New Common Shares per each Existing Share, and
  • 5.475% of the New Common Shares issued as a structuring fee to certain of the new money investors.

Trading in approximately 16 million New Common Shares issued to existing shareholders and holders of unsecured claims will commence on the NYSE one day after the Effective Date, on July 3, 2018, under the ticker symbol “SDRL”. Additional shares may commence trading in the coming weeks after a resale registration statement on Form F-1 with respect to additional shares issued on the Effective Date to certain investors is declared effective by the Securities and Exchange Commission. The Existing Shares will continue to trade on both the NYSE and Oslo Stock Exchanges under the same ticker symbol through the close of trading on the Effective Date but thereafter such trading will be suspended and the shares will be cancelled in due course.

Because the Company will continue to use the ticker symbol SDRL, holders of Existing Shares, brokers, dealers and agents effecting trades in the Existing Shares, and persons who expect to receive New Common Shares or effect trades in New Common Shares, should take note of the anticipated cancellation of the Existing Shares and issuance of New Common Shares, and the two different CUSIP numbers signifying the Existing Shares and the New Common Shares, in trading or taking any other actions in respect of shares of the Company that trade under the “SDRL” ticker.

Any questions regarding these distributions should be directed to the Company’s claims and noticing agent, Prime Clerk, on the numbers provided below.

Yesterday the OCC filed the preliminary notice (pdf) for how SDRL options would be treated. Below is the important part:

On April 17, 2018, United States Bankruptcy Court for the Southern District of Texas Victoria Division confirmed the Second Amended Joint Plan of Reorganization (“Plan”) for Seadrill Limited (SDRL). The Plan became effective on July 2, 2018, and SDRL shares were canceled. Under the Plan, SDRL shares will be converted into the right to receive approximately 0.0037345 (New) Seadrill Limited Common Share. Pursuant to the Plan, fractional shares will be rounded up or down to the nearest whole share with half shares being
rounded down.

Because fractional share amounts less than 0.5 will be rounded down, it is anticipated that SDRL1 options will not be adjusted to call for delivery of (New) SDRL Common Shares (100 x approximately 0.0037345 = approximately 0.37345). OCC will delay settlement until the final rate has been confirmed.

What this means is that the options will now be for zero shares of new SDRL. So one $0.50 put will pay out $50.00. So even if someone had bought $0.50 puts at $0.45 yesterday they will still make a nice 11% return. Do note that this OCC memo is preliminary and the final memo and settlement have not yet occurred. I will update this blog post once final settlement on the options has occurred.

Comparison to Ocean Rig (ORIG) bankruptcy emergence options adjustment

In September 2017 Ocean Rig UDW (ORIG) emerged from bankruptcy with old shareholders getting a tiny fraction of new shares. In that instance, the old options were cash-settled. See the preliminary OCC notice (dated 9/21/2017) and the final OCC notice (dated 9/27/2017).

From the preliminary OCC notice:

Ocean Rig UDW Inc. (ORIG) has announced a 1-for-9200 reverse stock split/Scheme of Arrangement. As a result of the reverse stock split/Scheme of Arrangement, each ORIG Common Share will be converted into the right to receive approximately 0.0001087 (New) Ocean Rig UDW Inc. Common Shares. The reverse stock split will become effective before the market open on September 22, 2017. Cash will be paid in lieu of fractional ORIG shares

The cash in lieu amount was then determined ( and announced in the final OCC memo:

Adjusted Ocean Rig UDW Inc. options were adjusted on September 22, 2017 (See OCC Information Memo #41867). The new deliverable became cash in lieu of approximately 0.01087 fractional ORIG Shares. The settlement of the ORIG1 options exercise/assignment activity was subject to delayed settlement.

OCC has been informed that a price of $23.50 per whole ORIG share will be used to determine the cash in lieu amount at a rate of 0.01087.

Accordingly, the cash in lieu amount is:
0.01087 x $23.50 = $0.26 per ORIG1 Contract

Now that the exact cash in lieu amount has been determined, OCC will require Put exercisers and Call assignees, during the period of September 22, 2017 through September 27, 2017, to deliver the appropriate cash amount

I was told by an experienced trader that I trust that how the OCC determines settlement in these cases of corporate events is determined by the company — so when a similar situation happens in the future both the cash in lieu of settlement and the rounding of shares (up or down) are both possible.

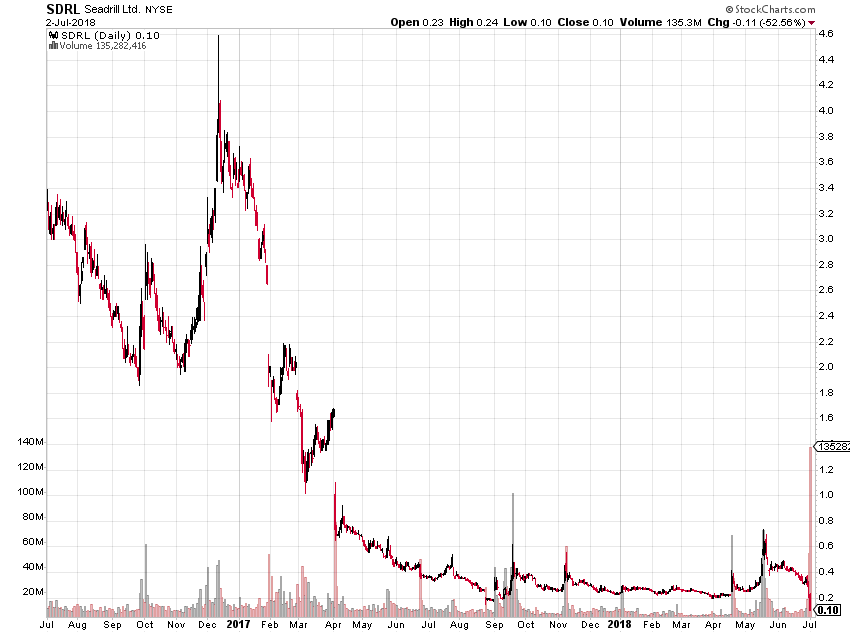
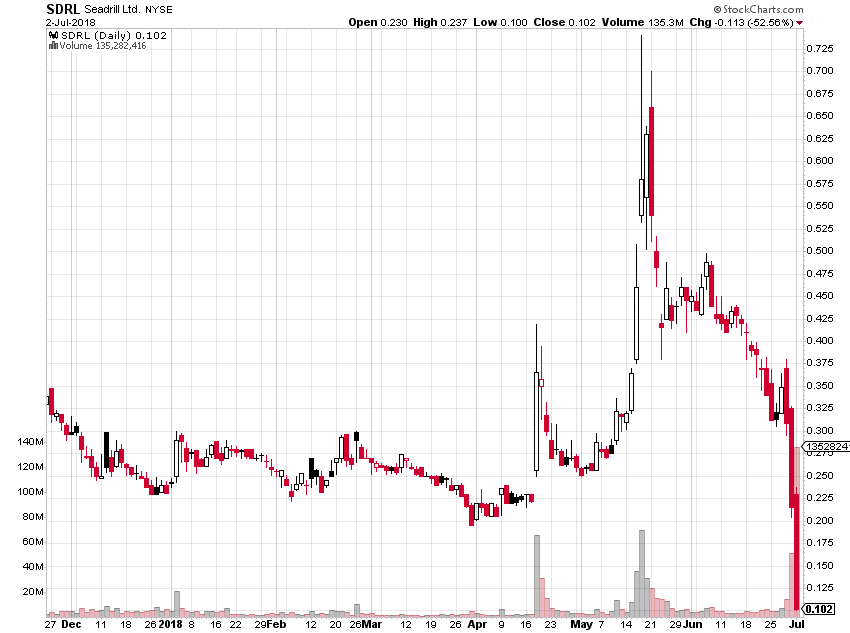
For the record: some final charts of Seadrill during the bankruptcy:


And here is a final chart of Seadrill affiliate North Atlantic Drilling (NADLQ), whose shareholders were completely wiped out in the bankruptcy:

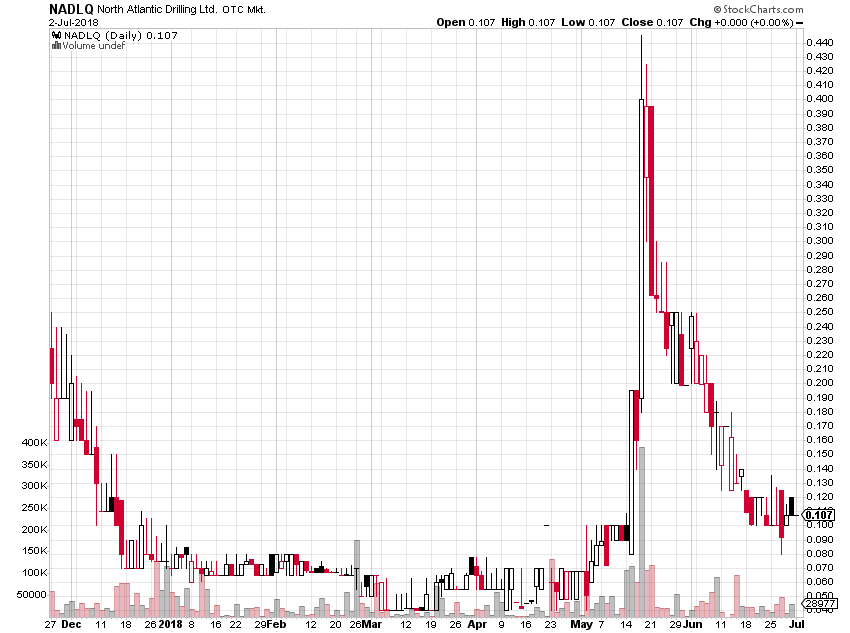
I did not short NADLQ because of the high borrow rate and low price and uncertainty about when the stock would be deleted.

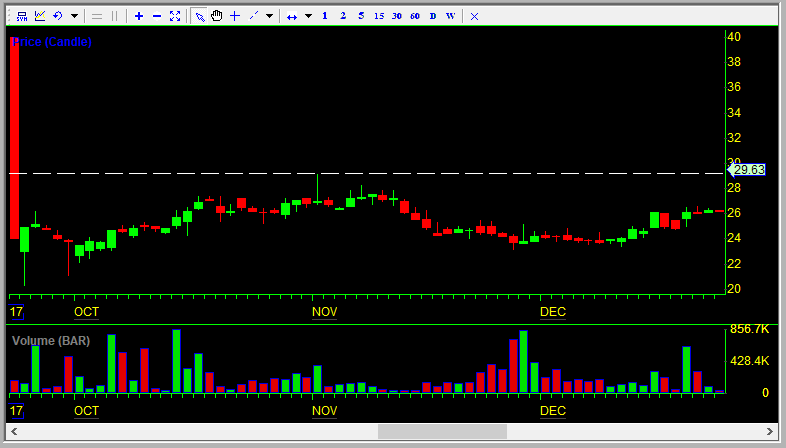
And here is the Ocean Rig UDW (ORIG) chart showing the time during which it emerged from bankruptcy — it appears that the two daily candlesticks in the $700 range are data errors — the stock closed at $0.075 on the last day of trading prior to emergence from bankruptcy and the 9200 for 1 reverse split. It opened around $40 the next day (it actually opened above $100 but those trades were busted)

Here are charts showing the actual prices (with no apparent data errors):

Disclaimer. I am short a tiny position of SDRL July 20th 2018 $0.50 calls. No position in any other stock mentioned and I have no relationship with anyone mentioned in this post. This blog has a terms of use that is incorporated by reference into this post; you can find all my disclaimers and disclosures there as well.

My new ergonomic workstation

Yay Ergonomics! If you sit down all day (not good for your back or legs), use a mouse and keyboard all day (not good for your wrists, at least for the more susceptible to repetitive strain injury), and need lots of monitor space, here is the setup for you.

I bought a new WorkRite Egonomics sit-to-stand desk that automatically doubles in height with the press of a button so that I can work sitting down or standing up (the price was surprisingly reasonable, on par with other quality desks that used hand cranks to adjust the height). (If you are in the St. Louis area I recommend buying this or other ergonomic office products from distributor Advanced Ergonomic Concepts; I was impressed by their speed and by attention to detail).


(click images for larger images)

My monitors are all Elo Touchsystems touchscreen monitors. I have two 19″ and two 24″ monitors. I have so far been impressed with their quality. I can’t wait until Windows 7 comes out because it will be designed for touchscreens. Until then I need to keep my mouse for certain tasks (like resizing windows).

So far, my wrists are feeling better after changing to touchscreens. The new desk will definitely help on busy trading days when I do not have time to take a break.

The only thing missing from this picture? Dragon Naturally Speaking 10, allowing me to control my computer with my voice and dictate. Unfortunately, the idiots at Nuance do not believe it is worth their time to adapt their program to Windows Vista 64-bit, even though it would benefit from the 64-bit architecture (or at least from the larger amounts of RAM that a 64-bit operating system can use; 32-bit Vista is limited to 3.5 GB).

[Edit later on 1/14/09 – I was able to install Dragon Naturally Speaking 9 on Vista 64 using this workaround. Thank you Chad.]

Are your deposits insured? How to avoid losing money in the coming bank Armageddon

I am not one to use the term Armageddon lightly. But when major banks like National City (NCC) and Washington Mutual (WM) are trading under 30% of book and Wachovia (WB) is trading at under 50% of book value, what othe term is appropriate? The market is pricing in a fair probability of a number of very large banks being bought out at firesale prices (like just happened to PFB) or being taken over by the FDIC and then being dismantled.

That being said, while the coming two years will be a very bad time to own bank stocks or bonds or to have uninsured deposits at banks (over the $100,000 FDIC limit), the economy will not completely collapse (though we should have a decent recession) and the world will move on.

The main thing to do is make sure that you and any friends and relatives never have more than $100,000 at any bank. If you wish to keep more, you may want to visit the FDIC website to see if your type of account is protected for more money (some are). You can search for your bank here and find out if it is insured by the FDIC and you can view financial information on your bank, even if it is private. For example, try searcing for “Home State Bank NA” in zip code 60014* (see random note at bottom of post). Then click on “Last Financial Information”, and on the next page click on “generate report”. This brings you to the bank’s balance sheet. If you click on the link towards the bottom for “past due and nonaccrual assets”, you will be taken to the good stuff. You can see that past-due loans have more than doubled over the last year. Unsurprisingly, much of the increase ($2.5m) was from “construction and land development loans”. It also pays to note that this big increase in past-due loans was solely in the 30 to 89 days late category. A more agressive bank might still be accruing interest on those loans. However, this is a conservative community bank and as you can see towards the bottom of the page, all loans that are more than 30 days late are non-accrual. (An interesting discussion of regulatory vs. tax requirements for deciding which loans are non-accruing can be found here.)

If you go back to the main balance sheet page and click on “net loans and leases” you can find the breakdown of loans. This is a good place to find out how risky your bank’s loan portfolio is. Unfortunately for Home State Bank, 20% of their loans are construction and land development loans. This bank is based in the far northwest exurbs of Chicago, so I think it likely that the bank will take a huge hit here. If you click on “1-4 family residential” you can see the breakdown of these loans. Luckily, most of these are first mortgages. Overall, Home State Bank looks okay. What about your bank?

If you have accounts as a credit union, visit NCUA to see details on insurance of your deposits. You can find your credit union and then request that a financial report be emailed to you. As an example I uploaded the report on my credit union. You can download the Excel Spreadsheet here. When analyzing credit unions, be aware that they will generally have more real estate exposure than similar commercial banks. Important things to examine are delinquent loans as a percent of assets (sheet 2, line 21 in the spreadsheet), asset mix including the amount of REO (sheet 4). If you are afraid of a bank run sparked by articles similar to this, take a look at the amount of uninsured deposits (sheet 5, lines 46-50). Delinquent loan info is always interesting (sheet7). For most of the data in the spreadsheet, an average of peer group credit unions is provided as well, making comparison easy. Overall, I think West Community looks quite safe.

What should you do if your bank doesn’t look safe (such as National City, where I have multiple accounts)? First thing that you should do is make sure your deposits are insured. Then make sure that you have enough cash in safer banks so that you can last awhile if you temporarily lose access to your money. Up until now the FDIC has been very good at getting depositors quick access to their insured deposits at a failed bank, but if things get really bad and big banks go down the FDIC could become backed up and take weeks or months to grant depositors access to their money. It pays to be prepared for such a scenario, even if it is unlikely.

*This bank, by the way, provided me with my first mortgage. Easiest mortgage I ever got — my father and I ran into Steve Slack, the bank president, while dining at the local country club, and I mentioned that I was buying a house in St. Louie. Slack gave me his card and told me to give him a call when I get close to finding a house. There are benefits to relationship banking–my extended family has banked there for three generations and uses the bank for a family company.

Disclosure: I am short several regional and local banks. 

The Coming Mortgage Crisis Part III: Low Interest Rates Do Not Make Housing More Affordable

Many people have argued that the current high house price to income ratio is not reason for house prices to decline, considering that interest rates are very low now. These people argue that what is important is not the actual price of the house, but the mortgage payment required to carry the house (for an example see user jcrash’s comments on my previous aritcles on the coming mortgage crisis at SeekingAlpha).

To some extent, these arguments are correct. Most home buyers use mortgages, and the difference in monthly payments between a 5.5% and a 8% mortgage is staggering. However, there are two important reasons why low interest rates do not mean that houses are affordable now: household debt is at an all-time high and mortgage rates will certainly go higher.

Total Debt Matters

Housing affordability is not independent of the affordability of other consumer goods. What matters for the affordability of housing and all consumer goods is the money available to pay for those goods (ie, money not spent on necessities). Total household debt is at an all-time high. The savings rate is close to zero. The most instructive number to look at is the household financial obligation ratio, or the ratio of income to household debt servicing and house or apartment-related expenses. To quote the Federal Reserve definition, “Debt payments consist of the estimated required payments on outstanding mortgage and consumer debt. The financial obligations ratio (FOR) adds automobile lease payments, rental payments on tenant-occupied property, homeowners’ insurance, and property tax payments to the debt service ratio.”

Keep in mind that these ratios do not include other non-discretionary expenses such as food and gasoline, the price of both of which has been increasing at staggering rates, which means that consumers have less ability to service their debt than even the following graph shows (click for a full-sized image). The data are available from the Federal Reserve. The key number to look at is the FOR Homeowner Total (light blue). Over the last decade this has increased from about 15% of income to about 19% of income.

for.pngThese are the costs on debt and home-related expenses that current homeowners pay. Because these are broad averages (many homeowners do not have mortgages after paying them off, reducing these ratios), it is important to look at the change over time. The ratio is currently about 4 percentage points higher than anytime prior to 2000. While this may not seem like much, consider that house prices are set on the margin and that approximately 40% of homeowners do not have mortgages. The marginal home buyer has much larger debt payments of all kinds than ever before, reducing his ability to buy. This alone indicates that home prices need to fall. However, the picture gets even bleaker when we look at mortgage rates.

Inflation Matters

Those that argue that house prices are affordable would agree that lower interest rates make houses more affordable, ceteris parabus. This is true not just for houses but for all capital assets. As interest rates increase, asset prices decrease. As interest rates fall, asset prices rise. If a buyer finances a high-priced asset with cheap financing and does not sell when financing becomes expensive, that buyer will do fine. However, a buyer who cannot hold indefinitely must pay attention to asset prices. Even when payments are equal, it is better to buy a cheap asset with expensive financing than to buy an expensive asset with cheap financing. The reason is simple: interest rates change. Interest rates are more likely to fall when they are high than when they are low. If they do fall, the seller who had bought when interest rates were high will have a capital gain as the price of the asset increases. However, the seller who buys when interest rates are low will take a capital loss if he sells after rates rise.

Inflation in the US is at a 4% annual rate as of March, and investors expect inflation to continue or get worse, as evidenced by the low yields on TIPS (Treasury Inflation Protected Securities). With 15- and 30-year fixed rate prime mortgages near their lowest rates since before the 1960s/1970s inflation epidemic, there is little place for mortgage rates to go but up. Even if housing were fairly affordable now (which the FOR ratios above show that it is not), higher interest rates will ensure that it becomes less affordable and that house prices need to continue to drop.

See Also

Option ARMageddon take on this issue

The Coming Mortgage Crisis: Part 1
The Coming Mortgage Crisis: Part 2

Disclosure: I have significant real estate holdings and I plan on selling short one or more regional banks.

The dumb way to steal from your investors

If a manager who runs a $30 million hedge fund decides to embezzle money, it usually makes sense to actually embezzle it and then run away, rather than just transferring it to a shell-company brokerage account and then losing half of it selling short Treasuries. Evidently someone forgot to give that sage advice to Matthew La Madrid and his hedge fund management company Plus Money. According to a recent SEC complaint:

The complaint further alleges that, unbeknownst to investors, in the fall 2007 Plus Money and La Madrid abandoned the covered call trading strategy, emptied out the monies in the Premium Return Funds’ brokerage accounts, and dissipated the money through a series of illicit transfers.

The SEC’s complaint alleges that investors were not told that in the fall 2007, La Madrid and Plus Money transferred nearly all monies from the Premium Return Funds’ brokerage accounts to Vision Quest Investments, a La Madrid dba, which in turn transferred $10 million to relief defendant Palladium Holding Company. The complaint further alleges that Palladium:

* Transferred $5 million to its own brokerage account and used the funds to trade in numerous short-sell transactions involving Treasury bonds; as of April 25, this activity had depleted more than half of the account’s value
* Wired $500,000 back to La Madrid
* Transferred $1.8 million to several real estate title companies
* Used $95,000 towards the purchase of two automobiles
* Transferred another $90,000 to a Denver-based car dealership

What I do not understand is why La Madrid did not simply make the losing bets in the hedge fund. If he had lost the money in the fund then he would have been guilty of little more than misleading his investors about his investment strategy (the fund was supposed to invest in covered calls).

The Coming Mortgage Crisis: Part II

Things are different this time. That is what I argued in my previous post on the coming mortgage crisis. Exploding option ARMs will lead to record foreclosures, which will cause house prices to further decline, which will cause many households to have negative equity. Rather than pay mortgages that are larger than house values, people will simply walk away.

One additional factor that will cause great harm to the housing market is that many stated income loans fraudulently overstated income ( I almost committed mortgage fraud myself). Bond insurers and buyers of RMBS and CDOs will force these back onto the balance sheets of investment banks and mortgage originators, leading to a further decrease in lending and an increase in lending standards. This will increase the cost of buying a house and put further downward pressure on house prices. The Market Ticker blog has a good discussion of this problem and the harm it will cause to banks.

Following are a couple more graphs to support my case that the bubble is nowhere near finished deflating. The first is the average house price to income ratio across the US, courtesy of PIMCO.

pimco.jpg

The second is a beautiful graph of home prices in every city in the Case/Shiller home price index. This comes courtesy of The Mess that Greenspan Made blog.

tim.png

You can see from this graph that home prices have a long way to go before they return to pre-bubble levels. Cleveland and Detroit are back to the 2000 price levels, but the fundamental deterioration in those cities means that prices should fall further. Detroit and Cleveland have had declining populations for a number of years, and that trend continues. It is predicted that Detroit will continue to lose population and have only 705,000 residents in 2035, down from 890,000 in 2005.

Disclosure: I own real estate in St. Louis and Chicago. I have a short position in a land development company. I have a full disclosure policy.

The coming mortgage crisis

If you read the papers and watch the news, you may believe that we are in and have been in a subprime mortgage crisis for the last year or so. That is true. Many pundits are also saying that the subprime crisis is nearing its end. That is also true, to a point. Subprime mortgage troubles will not inflict that much more damage on the broader economy. However, prime and Alt-A mortgages with toxic features will cause troubles that will make the current troubles look like a walk in the park. Furthermore, broad-based declines in housing prices will start to wreak havoc on housing markets across the country.

The Cataclysmic Shift

The problem with the housing market bulls is that they are thinking within the framework of past housing downturns. The current downturn is unlike any other since the Great Depression. No other downturn has started with houses so overpriced relative to rents. Few downturns started with such reasonable interest rates. No other downturn saw double digit house price declines across the country. This downturn is different, and it is going to lead homeowners (or homedebtors, as the Irvine Housing Blog calls those who have little equity) to change their behavior in ways that only the pessimists such as myself anticipate.

The problem with most predictions is that they are linear extrapolations of the past into the future. Have global temperatures been rising? They will continue to rise at the same rate. Has crime been increasing? It will continue to increase at a similar rate. The problem is that significant change often comes suddenly. That is why no one who knows anything is worried about the gradual increases in the Earth’s temperature that will occur if global warming continues. What really scares people is the possibility (however remote) that the changes could accelerate or could cause something unexpected to happen (such as the jet stream moving or the ocean currents changing). A thorough review of the history of global temperatures reveals that such cataclysmic change is not unusual.

In the case of housing, the cataclysm will come within the next couple years. It will be fueled by two factors: option ARM mortgage recasts and house price declines. (Slate has a worthwhile take on what will happen, but its analysis is less detailed than mine.)

Why House Prices will Continue to Decline

House prices are elevated relative to rents and relative to incomes, especially in the hottest markets, such as California, Nevada, Florida, and Arizona. However, price increases in middle America have been no less astonishing. One example with which I am all too familiar is the house I just sold in the Saint Louis suburb of Maplewood. Zillow has a decent graph of the house’s value, although it is not completely correct. If you look at the county assessor’s website (and search by the address) you can see that the house sold for $100k back in 1997 and then for $188k in 2004. I just sold it for $165k. Over this period of time few renovations of note were done on the property and the neighborhood did not improve significantly. The employment situation in the area has not changed. So from 1997 to 2004 the house appreciated by 88%, while between 1990 and 1997, during great economic times, the house appreciated by only 25%. In relation to both rents and area incomes, the house is still probably 20% overvalued.

Housing Starts

Moving from the anecdotal to the statistical, we can see that this is not an isolated situation. The chart above shows housing starts and permits for the last 30 years. Over this period the population has increased at a fairly steady rate. Since 2003 there have been too many houses built. This will lead inevitably to falling prices.

Orange County Price to Income

If you look at the ratio of income to house prices in the above graph (from Piggington’s Econo-Almanac), you will see that house prices are way higher than they should be relative to incomes (while this graph is for one area of California, prices are elevated relative to incomes across most of the country). While creative financing can lead to a bubble in prices, there is no way for house prices to remain unaffordable indefinitely.

Price to Rent ratio

Another thing to consider is that house prices remain tethered to rental prices over the long term. If renting is cheaper than buying, people will choose to rent rather than buy and house prices will fall. House prices have never been so much higher than rental prices than they are now. Above is a chart of the ratio of the OFHEO house price index to the CPI-Owner’s equivalent rent.

Foreclosures

Another factor weighing on prices is the increase in foreclosures. Banks that own foreclosed houses are motivated sellers and they will cut the prices so that they can sell their inventory. Increasing foreclosures will increase supply and decrease prices of transactions. Why pay $200k for a house when your neighbor but his out of foreclosure for $140k? Foreclosures are actually understated because banks often don’t have the manpower necessary to foreclose and sell delinquent properties.

The foreclosure problem will soon get much worse. Considering that it often takes over half a year (and can take much longer) between when a homedebtor falls behind on a mortgage and when the house is repossessed, the current wave of foreclosures began before house prices had fallen significantly. With prices now down 20% in many areas and 30% or more in some areas, the rate of foreclosures will increase drastically over the next year. Those that need to sell and who have little equity will be unable to sell for more than they owe. Short sales are difficult, so foreclosure will be the last resort for many who need to move.

Even though asking prices for houses have fallen dramatically already, they have not fallen nearly enough: witness the low volume of house sales relative to prior years. In the graph below we can see that the spring selling season in San Diego has been a bust, as it has elsewhere (image from the Bubble Markets Inventory Tracker blog).

sd-house-sales.jpg

Option ARM Recasts

Besides falling house prices, another factor in the coming mortgage crisis is the coming recasts of millions of option ARM mortgages. Most of you will be familiar with the problem of interest rate resets on ARMs (adjustable rate mortgages). This problem is well-known. Almost all ARMs have fixed rates for the first couple years and then the rates reset to market rates. Considering the current low interest rate environment, this problem is likely overblown.

imfresets.jpg

The greater problem, however, is recasts. Option ARMs allow for the choice of the size of the payment. Homedebtors can choose to pay an amortizing payment (such that their mortgage balance is reduced), an interest-only payment, or a negative-amortizing payment, where their mortgage balance increases. Recent data from Countrywide indicates that 71% of borrowers with option ARMs are only making the minimum, negative-amortizing payment. Option ARMs have provisions such that when the mortgage balance exceeds the original mortgage by 10% to 15%, the loan converts into a fully self-amortizing loan. Considering that many of these loans were made over the last few years (beginning in 2005), we should start to see a number of recasts. When a mortgage recasts, the payment size can easily double or triple. Those who could afford their payments before will no longer be able to do so.

Option ARMs are highly prevalent, especially in the most bubbly markets. See the following map and click on it for a larger version (courtesy of the Irvine Housing Blog):

map_of_misery.jpg

The Coming Crisis

The coming crisis will be caused by option ARM recasts, falling prices, and banks’ increasing reluctance to lend. The crisis will manifest itself in people simply walking away from houses where their mortgage is worth more than the house. Considering how many people have used home equity loans to remove equity, how many have had negative amortization in their loans, and considering how small down payments became over the last few years, very few homeowners will be left with equity in their houses. Economy.com currently estimates that 9 million households have negative equity. That figure could easily double or triple as house prices fall by another 20% to 30%.

The assumption on the part of mortgage lenders, regulators, and housing market optimists is that as long as people can afford to pay their mortgages, they will. But homedebtors faced with 20% to 30% negative equity will be much better off going through foreclosure than they will paying off their debts. Helping them is the fact that in a number of states, purchase money mortgages are non-recourse debt, meaning that banks cannot sue to recover the money they lose. The sheer number of foreclosures will mean that banks will not have the manpower to go after domedebtors even when they want to do so.

The rising tide of foreclosures caused by people walking away from houses in which they have negative equity will act as part of a positive-feedback loop to increase the rate of price declines. The housing market is not getting better anytime soon and it will soon get much, much worse.

Interim Performance Review

Your humble blogger is not averse to eating crow. So it is time to admit that I have been wrong so far about Frederick’s of Hollywood [[foh]] (Movie Star Inc prior to a recent reverse merger). It is difficult to invest without knowing all the information, and I appear to have been over-optimistic about the growth of the company. Especially with competitors like Limited Brands [[ltd]] (owner of Victoria’s Secret) selling quite cheaply, Frederick’s does not look like a worthwhile stock to buy. Frederick’s stock has recently fallen from $3.60 to $2.80 (its 52-week low after adjusting for a recent 2-for-1 reverse split).

On the other hand, my bearish advice continues to be very good: since scolding Patrick Byrne and Overstock.com [[ostk]] in a Dueling Fools article (for The Motley Fool), the stock has declined from $15.76 to $8.90.

In other news, despite Exmocare (OTC BB: EXMA, formerly 1-900 JACKPOT) being a horridly overvalued useless piece of trash with no sales and no significant book value and no chance of ever being worth one-tenth of its market cap, its stock has gone up since I pledged the profits from my short position in the stock to charity. The 1st Annual GoodeValue.com Short-a-Thon was a failure and raised $0 for charity.

Disclosure: I have no position in any stock mentioned. I trained in the dark arts of Jedi under the Sith Lord himself. My disclosure policy wants you to read it.

Paye Tes Dettes!

The title of this post comes from the Charles Trenet song about the importance of paying off one’s debts (full lyrics).

In the search of good value we must be willing to take necessary risks. We must be willing to bet on struggling companies, sometimes with bad management, sometimes in struggling industries. We must never combine those three, however. Most important of all, we must shun excessive debt like the plague. While I prefer to avoid companies with significant debt, in cases in which the company has consistent earnings and the ability to maintain those earnings (because of strong brands or monopoly status), debt is forgivable.

For companies with tough competition and little competitive advantage, debt is a very, very bad idea. Two great cases in point are Movie Gallery (MOVI) and General Motors (GM). Both companies have historically strong brands and decent business models. They are both extraordinarily cheap. If they had less debt they would be great companies to buy. Saddled with debt, however, they lack the ability to survive their cut-throat industries.

Movie Gallery is a great example of stupid management harming a company. The company’s stock traded as high as $30 in 2005; it now trades at $4. Movie Gallery runs a chain of video rental stores. They have historically been profitable. However, early in 2005 the company took on much debt to buy Hollywood Video. The company now has a market cap of $130 million and debt of $1.1 billion.

I would argue that the movie rental business is one of the best businesses to be in. People like watching movies, new movies cost a lot to see at movie theaters, and the competition (satellite and cable movies on demand) are not that great. While Netflix (NFLX) has made it harder for bricks and mortar stores, I feel its impact has been drastically over-rated. I subscribe to the Netflix service, but there are plenty of people who do not. A bricks and mortar store can do good business because those that rent less frequently will not subscribe to Netflix.

Therefore, I think that Movie Gallery’s two chains, Movie Gallery and Hollywood Video, will still be around in one form or another fifteen years from now. The problem is that the debt of the current company will likely result in bankruptcy and leave the stock worthless.

General Motors faces much the same problem. Unfortunately for the careless investor, their full debt his hidden in details in their financial statements about their union contracts and the number of retirees for whom they provide pensions. Some have estimated that GM will have to pay out over $70 billion in pensions and health care benefits to its current and future retirees. For a company that has consistently lost a few billion dollars per year over the last few years, this is a problem.

In addition to its debt, GM has too many brands, too much production capacity, an unfavorable union contract, and shrinking sales. Without such a sizable debt, GM would stand a chance of restructuring and saving its stockholders. As it stands, it has no room to maneuver. Unless it can become highly profitable within a year or at most two years, it will go bankrupt.

So does debt matter for stock returns? Yes, at least according to “Predictability of UK Stock Returns by Using Debt Ratios” by Muradoglu and Whittington (scroll down on the page to which I link to download the PDF). While the data are from the UK, the results are logical and should apply in the USA as well. While the correlation of debt ratio with stock returns is lower than the correlation of P/E with stock returns, there is still a definite negative correlation: the stock of those companies with the least debt did the best. The 30% of companies with the lowest debt showed a consistent advantage over those with higher debt. Those companies had gearing ratios (leverage ratios for you Americans) of under 20%, meaning that total debt represented less than 20% of enterprise value. There are other ways of reporting leverage but I like this one. For comparison, MOVI has a gearing ratio of 89%, while GM has a gearing ratio of 96%.

Disclosure: I have no position in any company mentioned. This was originally written two years ago and published elsewhere. Movie Gallery has since declared bankruptcy. I have a disclosure policy.