Beware the ATM: ARCA Biopharma (ABIO) Edition

It has been awhile since my last trading strategy post so I thought I would write one about something that I have been paying attention to recently. If you don’t know my core beliefs on trading strategy, read these classic blog posts first:

So you want to be a trader, Part 1
So you want to be a trader, Part 2: Finding a trading system & dealing with emotion

A good chunk of the money I make comes from day-trading. The most important thing when considering a day-trade is that fundamentals almost don’t matter — what matters is supply and demand for the stock. If you can identify situations where demand will drop throughout the day or supply will increase, or both, you will be able to profit from short-selling. Conversely, if you can identify decreasing supply or increasing demand, you can profit from buying.

Perhaps one of the most predictable sources of increased supply of stock is the company issuing shares through an already-existing ‘at-the-market’ offering, commonly known as an ATM. Now it is one thing to identify a situation where a company has an outstanding ATM facility and the company needs cash (as can be known by looking at the balance sheet and cash flow statement). That is certainly useful and many traders do that. But wouldn’t it be even better to spend the time to follow such situations prospectively and then identify how often and how much those ATMs were actually used?

This is what I am spending time and effort on right now: whenever I see a stock gapping up on news that I might want to short because the news isn’t really that great, I look for outstanding ATMs. Regardless of whether I trade the stock or not, I make a note to look back at the SEC filings in the future to see if the company actually did sell shares through the ATM on that and following days. By doing this I will get a better sense of how reliably companies will use their ATMs in these situations and this will help me better evaluate the risks of shorting these stocks.

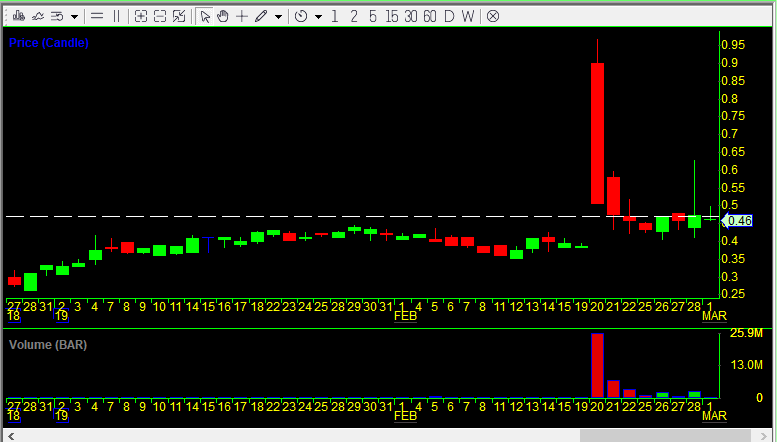
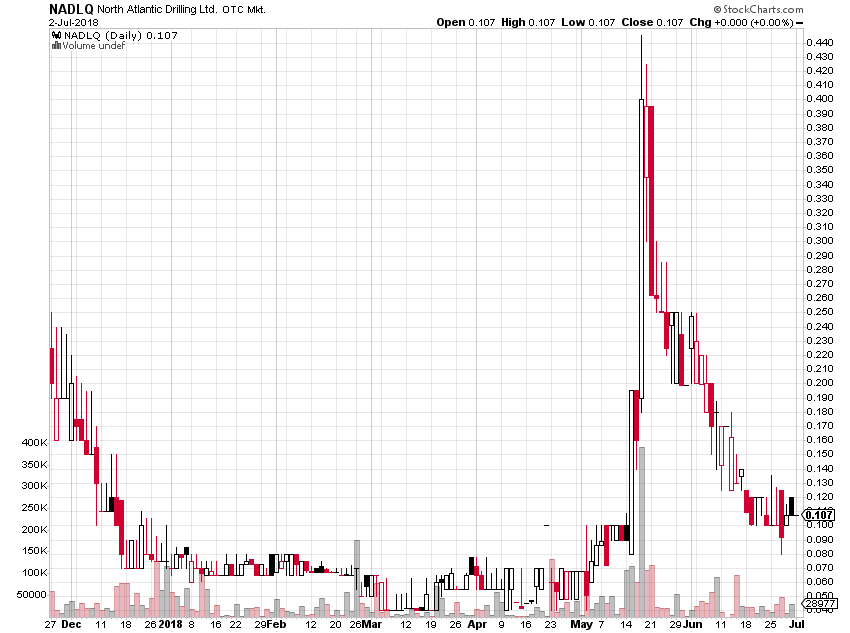
The first stock I made a note to look back at was Arca Biopharma (ABIO). This makes for a perfect example because the company put out a 10-K soon after having a big spike on February 20, 2019, and the stock had very low volume prior to that spike. So let’s take a look. Below is the daily candlestick chart of ABIO for the year up until today.

Having identified the stock as worthy of interest and having an ATM on February 20th, we can now look at the filings to see if it used that ATM. On February 27nd, the company filed its 10-K for the year ended December 31st. On the first page we find this: “As of February 22, 2019, the Registrant had 18,355,111 shares of common stock outstanding.” The balance sheet lists 13,924,058 shares outstanding as of December 31st, 2018. So from January 1st to February 22nd, 201 ABIO issued 4.43 million shares, increasing the share count by 31.8%. Next we go to the section entitled “(7) Equity Financings and Warrants” — I knew to go there because I searched the document for “at the market” (if that doesn’t work search “at-the-market”. Unfortunately, that just describes the ATM usage for 2017 and 2018 — I want more recent issuance so I go to the “subsequent event(s)” section.

In January 2019, the Company amended the Sales Agreement to increase the maximum aggregate value of shares which it may issue and sell from time to time under the Sales Agreement by approximately $2.5 million, from $10.2 million to $12.7 million. Subsequent to December 31, 2018, the Company sold an aggregate of 4,431,053 shares of its Common Stock pursuant to the terms of the Sales Agreement, as amended, for aggregate gross proceeds of approximately $2.5 million. Net proceeds received in the period were approximately $2.4 million, after deducting initial expenses for executing the “at the market offering” and commissions paid to the placement agent. As of February 22, 2019, the Company has sold all shares available under its current prospectus to the Company’s registration statement on Form S-3 (No. 333-217450).

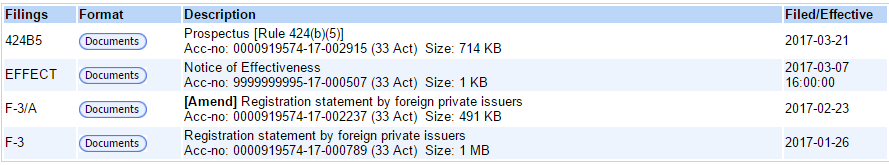
So between January 1st and February 22nd of 2019 Arca Biopharma sold 4.431 million shares through its ATM (which is now exhausted — the company will have to file an amended S-3 registration statement if it wishes to sell more shares) for gross proceeds of $2.5 million. Divide $2.5m by 4.431m shares to get an average price of $0.5642 per share. Given that prior to February 20th, the stock traded an average of under 200,000 shares per day and never traded over $0.45, it is a good bet that Arca Biopharma sold no shares during that time period. (Also, as of the amended prospectus on January 25th, the company said it had sold a total of $10,083,445 worth of stock through its ATM, while as of Frebruary 22nd that was $12.6 million, meaning the company sold no shares or almost no shares from January 1st to January 22nd.)

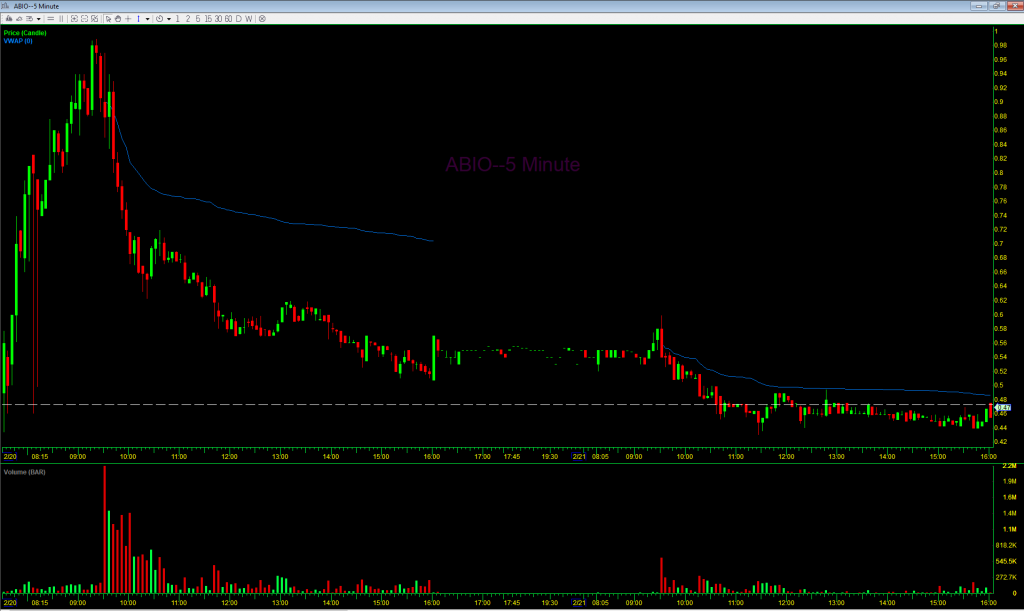
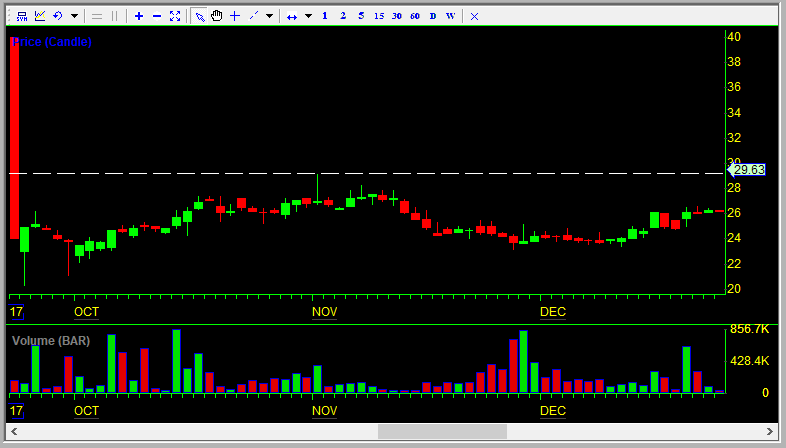
On February 20th, the stock opened at $0.90, hit a high of $0.97, and closed at the low of $0.508. Below is an intraday 5-minute candlestick chart of ABIO from that day. Note that the volume-weighted average price (VWAP) was $0.704 at the end of the day. The next day the VWAP was $0.487. So it is likely that the company sold a large number of shares over both days. The volume on February 20th was 25.94 million shares, and it was 7.14 million shares the next day. Over those two days the company likely sold 4.43 million shares, 13.4% of the total trading volume those days. It is important to look at the total trading volume like this and not just the increase in shares outstanding because if the number of shares sold by the company is small relative to the trading volume it is still possible for the stock to spike big. But here, with 13.4% of the volume being sales by the company through the ATM, that was not possible and it was all but inevitable that the stock would drop as it did.

(Two day 5-minute candlestick chart;click to enlarge)

For more on dilution, I recommend following AuspexResearch on Twitter. He is the one who got me to start looking at this stuff a couple years ago. Read a few of his Twitlonger posts.

Below is the full text of the February 20th press release that caused the stock to spike:

ARCA Biopharma Announces FDA Agreement for a Single Phase 3 Clinical Trial to Support Approval for the First Genetically-Targeted Cardiovascular Drug

GlobeNewswire•February 20, 2019
FDA Special Protocol Assessment agreement granted for PRECISION-AF clinical trial evaluating Gencaro as a potential treatment for atrial fibrillation in a heart failure population that has no FDA approved drug therapies 58% treatment benefit seen versus active comparator in Phase 2B for planned Phase 3 target population
Gencaro development program has FDA Fast Track designation
U.S. and European cardiovascular patents and regulations may provide commercial exclusivity for Gencaro for 10 years post approval
WESTMINSTER, Colo., Feb. 20, 2019 (GLOBE NEWSWIRE) — ARCA biopharma, Inc. (ABIO), a biopharmaceutical company applying a precision medicine approach to developing genetically-targeted therapies for cardiovascular diseases, today announced that it has reached agreement with the U.S. Food and Drug Administration (FDA) regarding a Special Protocol Assessment (SPA) on the design of a pivotal Phase 3 clinical trial, PRECISION-AF, to assess the safety and efficacy of GencaroTM (bucindolol hydrochloride) as a genetically-targeted treatment for atrial fibrillation (AF) in patients with a specific type of heart failure (HF). The target population for the planned Phase 3 clinical trial, partially identified by precision therapeutic phenotyping, currently has no FDA approved drug therapies. This SPA provides agreement that the Phase 3 protocol design, clinical endpoints, trial population and statistical analyses adequately address objectives that, if met, would support a regulatory submission seeking approval of Gencaro for the prevention of AF recurrence in a genotype-defined HF population.
If PRECISION-AF is successful and Gencaro gains regulatory approval, it has the potential to be unique in several aspects, including:
The first genetically-targeted cardiovascular therapy;
The only drug therapy indicated in HF patients with mid-range ejection fraction (HFmrEF); and,
The only drug therapy for AF approved against an active comparator.
The SPA process is designed to facilitate review and approval of drugs by allowing FDA to evaluate the proposed design and size of specific clinical trials that are intended to form the primary demonstration of a drug product’s efficacy and safety. FDA ultimately assesses whether the protocol design and planned analysis of the trial are acceptable to support regulatory approval of the product candidate for the indication studied. An SPA agreement can potentially reduce the regulatory risk of bringing a drug to market.
“Consistent with our mission to develop precision therapies on a pharmacogenetic platform, this SPA agreement with the FDA provides a clearly defined regulatory pathway for the Phase 3 development of Gencaro in a genotype-specific heart failure population that currently has no FDA approved drug therapy,” said Michael R. Bristow, MD, PhD, Chief Executive Officer of ARCA biopharma. “If the previous foundational therapeutic observations in the GENETIC-AF and BEST trials are confirmed in PRECISION-AF, we believe Gencaro could potentially provide a new standard of treatment for AF prevention for the estimated 2.5 million HFmrEF patients in the major markets in U.S., Europe and Japan.”
In accordance with the Company’s SPA agreement with FDA, PRECISION-AF is designed as a single, adequate and well-controlled Phase 3 clinical trial that may be sufficient to support an New Drug Application (NDA) submission for an AF indication if the objectives of the trial are achieved consistent with the requirements of the SPA. The trial is designed as a double-blind, active-controlled, multicenter, international study comparing Gencaro with Toprol-XL (metoprolol succinate) for the prevention of AF recurrence or all-cause mortality (ACM) in HFmrEF patients. HFmrEF is defined as HF with a left ventricular ejection fraction (LVEF) ≥ 40% and < 50%, which constituted approximately half of the enrolled population in the Phase 2 GENETIC-AF trial. PRECISION-AF is designed to enroll approximately 400 patients who have: HFmrEF, a recent AF event, and the genotype which responds most favorably to Gencaro. The primary endpoint of the trial will be time to first event of atrial fibrillation/atrial flutter (AF/AFL) or ACM during the 26-week Follow-up Period. In the recently completed GENETIC-AF trial, Gencaro showed a 58% treatment benefit compared to Toprol-XL in reducing AF recurrence in the HFmrEF population targeted for Phase 3 (hazard ratio = 0.42; 95% CI: 0.21, 0.86; p = 0.017). With 400 patients (200 per arm) the trial will have 90% power at a p-value of 0.01 to detect a 45% treatment benefit for Gencaro compared to Toprol-XL. Subject to securing additional financing, ARCA anticipates initiating PRECISION-AF in the fourth quarter of 2019.
About Special Protocol Assessment (SPA)
An SPA is an agreement with the FDA that the proposed trial protocol design, clinical endpoints and statistical analyses are acceptable to support regulatory approval. For further information regarding the SPA process, please visit the FDA website, www.fda.gov. A SPA agreement is not a guarantee of approval, and there are no assurances that the design of, or data collected from, the planned Gencaro clinical trial (PRECISION-AF) will be adequate to obtain the requisite regulatory approvals for the marketing of Gencaro.
About Atrial Fibrillation (AF)
AF, the most common sustained cardiac arrhythmia, is a serious disorder in which the normally regular and coordinated contraction pattern of the heart’s two small upper chambers, or the atria, becomes irregular, rapid and uncoordinated. AF can cause distressing symptoms that significantly impact quality of life and can also bring potentially serious medical consequences, including increasing the risk of stroke and serious cardiovascular complications. AF is considered an epidemic cardiovascular disease and a major public health burden. In 2015, there were approximately 5.2 million patients who had been diagnosed with AF in the United States. It is estimated that AF costs the U.S. economy about $6.0 billion annually.
About ARCA biopharma
ARCA biopharma is dedicated to developing genetically-targeted therapies for cardiovascular diseases through a precision medicine approach to drug development. ARCA’s lead product candidate, GencaroTM (bucindolol hydrochloride), is an investigational, pharmacologically unique beta-blocker and mild vasodilator being developed for the potential treatment of atrial fibrillation in heart failure patients with mid-range ejection fraction. ARCA has identified common genetic variations that it believes predict individual patient response to Gencaro, giving it the potential to be the first genetically-targeted AF prevention treatment. The Gencaro development program has been granted Fast Track designation by FDA. ARCA is also developing AB171, a thiol-substituted isosorbide mononitrate, as a potential genetically-targeted treatment for heart failure and peripheral arterial disease (PAD). For more information, please visit www.arcabio.com.
Safe Harbor Statement
This press release contains “forward-looking statements” for purposes of the safe harbor provided by the Private Securities Litigation Reform Act of 1995. These statements include, but are not limited to, potential future development plans for Gencaro, ARCA’s ability to complete any Phase 3 clinical trial, the likelihood for PRECISION-AF results to satisfy the requirements of the SPA, ARCA’s ability to raise sufficient capital to fund the PRECSION-AF trial and its other operations, the expected features and characteristics of Gencaro, including the potential for genetic variations to predict individual patient response to Gencaro, Gencaro’s potential to treat AF and/or HFmrEF, future treatment options for patients with AF and/or HFmrEF, and the potential for Gencaro to be the first genetically-targeted AF prevention treatment. Such statements are based on management’s current expectations and involve risks and uncertainties. Actual results and performance could differ materially from those projected in the forward-looking statements as a result of many factors, including, without limitation, the risks and uncertainties associated with: ARCA’s financial resources and whether they will be sufficient to meet its business objectives and operational requirements; ARCA may not be able to raise sufficient capital on acceptable terms, or at all, to continue development of Gencaro or to otherwise continue operations in the future; an FDA SPA agreement does not guarantee approval of Gencaro or any other particular outcome from regulatory review; results of earlier clinical trials may not be confirmed in future trials; the protection and market exclusivity provided by ARCA’s intellectual property; risks related to the drug discovery and the regulatory approval process; and, the impact of competitive products and technological changes. These and other factors are identified and described in more detail in ARCA’s filings with the Securities and Exchange Commission, including without limitation ARCA’s annual report on Form 10-K for the year ended December 31, 2017, and subsequent filings. ARCA disclaims any intent or obligation to update these forward-looking statements.
Investor & Media Contact:
Derek Cole
720.940.2163
derek.cole@arcabio.com
A photo accompanying this announcement is available at http://www.globenewswire.com/NewsRoom/AttachmentNg/af496e97-20da-420a-bf93-e51b3a3ed740

Disclaimer: I have no position in any stock mentioned above. I have no relationship with any parties mentioned above. This blog has a terms of use that is incorporated by reference into this post; you can find all my disclaimers and disclosures there as well.

The Great Seadrill trade I missed and the OCC

First, because I cannot resist — just replace “OPP” with “OCC” when you sing along.


I’m not down with OPP. But I am down with The OCC (The Options Clearing Corporation). They are the ones who determine settlement and other important technical details of traded options. For most options traders, The OCC is unimportant — each option has a strike price and an expiry date and that is all that really matters. But when there are corporate events such as mergers, splits, bankruptcies, and the like, the OCC’s decisions become important.

Seadrill Inc (SDRL) just emerged today from its long trip through bankruptcy. From the company’s press release:

SDRL – Seadrill Announces Emergence from Chapter 11

Hamilton, Bermuda, July 2, 2018 – Seadrill Limited (“Seadrill” or the “Company“) announces today (the “Effective Date“) that it has emerged from chapter 11 after successfully completing its reorganization pursuant to its chapter 11 plan of reorganization (the “Plan“). All conditions precedent to the restructuring contemplated by the Plan have been satisfied or otherwise waived.

The Plan has equitized approximately $2.4 billion in unsecured bond obligations, more than $1 billion in contingent newbuild obligations, substantial unliquidated guaranty obligations, and c. $250 million in unsecured interest rate and currency swap claims, while extending near term debt maturities, providing the Company with over $1 billion in fresh capital and leaving employee, customer, and ordinary trade claims largely unimpaired.

The Plan has re-profiled the Company’s debt and provided substantial liquidity that puts the Company in a strong position to execute its business plan. The figures presented below highlight key financial metrics as of the Effective Date:

  • total cash of c.$2.1 billion;
  • secured bank debt of c.$5.7 billion with the first maturity in 2022;
  • new Secured Notes of c.$880 million maturing in 2025;
  • backlog of c.$2.3 billion for Seadrill Limited, excluding Seamex and Seadrill Partners; and
  • common shares issued of 100 million as described further below.

Issuance, Listing and Trading of New Common Stock

The Company has received approval to list its new common shares with the new CUSIP number G7998G 106 (the “New Common Shares“) on the New York Stock Exchange (the “NYSE“) under the same NYSE ticker symbol “SDRL” as the Company’s existing common shares (with the CUSIP G7945E 105) (the “Existing Shares“).  Subject to the relevant approvals, the Company also intends to have its equity listed on the Oslo Stock Exchange (ISIN BMG7998G1069).

On the Effective Date, the Company will have approximately 100 million New Common Shares outstanding.  The New Common Shares will be allocated as set forth below, in accordance with provisions of the Plan and issued on the Effective Date:

  • 14.25% of the New Common Shares issued to holders of unsecured claims against the Company and certain of its chapter 11 debtor affiliates;
  • 23.75% of the New Common Shares issued to participants in the $200 million equity investment under the Plan;
  • 54.625% of the New Common Shares issued to participants in the $880 million new secured notes investment under the Plan;
  • 1.9% of the New Common Shares issued to holders of existing common equity interest in the Company as of the Effective Date, an effective exchange ratio of approximately 0.0037345 New Common Shares per each Existing Share, and
  • 5.475% of the New Common Shares issued as a structuring fee to certain of the new money investors.

Trading in approximately 16 million New Common Shares issued to existing shareholders and holders of unsecured claims will commence on the NYSE one day after the Effective Date, on July 3, 2018, under the ticker symbol “SDRL”. Additional shares may commence trading in the coming weeks after a resale registration statement on Form F-1 with respect to additional shares issued on the Effective Date to certain investors is declared effective by the Securities and Exchange Commission. The Existing Shares will continue to trade on both the NYSE and Oslo Stock Exchanges under the same ticker symbol through the close of trading on the Effective Date but thereafter such trading will be suspended and the shares will be cancelled in due course.

Because the Company will continue to use the ticker symbol SDRL, holders of Existing Shares, brokers, dealers and agents effecting trades in the Existing Shares, and persons who expect to receive New Common Shares or effect trades in New Common Shares, should take note of the anticipated cancellation of the Existing Shares and issuance of New Common Shares, and the two different CUSIP numbers signifying the Existing Shares and the New Common Shares, in trading or taking any other actions in respect of shares of the Company that trade under the “SDRL” ticker.

Any questions regarding these distributions should be directed to the Company’s claims and noticing agent, Prime Clerk, on the numbers provided below.

Yesterday the OCC filed the preliminary notice (pdf) for how SDRL options would be treated. Below is the important part:

On April 17, 2018, United States Bankruptcy Court for the Southern District of Texas Victoria Division confirmed the Second Amended Joint Plan of Reorganization (“Plan”) for Seadrill Limited (SDRL). The Plan became effective on July 2, 2018, and SDRL shares were canceled. Under the Plan, SDRL shares will be converted into the right to receive approximately 0.0037345 (New) Seadrill Limited Common Share. Pursuant to the Plan, fractional shares will be rounded up or down to the nearest whole share with half shares being
rounded down.

Because fractional share amounts less than 0.5 will be rounded down, it is anticipated that SDRL1 options will not be adjusted to call for delivery of (New) SDRL Common Shares (100 x approximately 0.0037345 = approximately 0.37345). OCC will delay settlement until the final rate has been confirmed.

What this means is that the options will now be for zero shares of new SDRL. So one $0.50 put will pay out $50.00. So even if someone had bought $0.50 puts at $0.45 yesterday they will still make a nice 11% return. Do note that this OCC memo is preliminary and the final memo and settlement have not yet occurred. I will update this blog post once final settlement on the options has occurred.

Comparison to Ocean Rig (ORIG) bankruptcy emergence options adjustment

In September 2017 Ocean Rig UDW (ORIG) emerged from bankruptcy with old shareholders getting a tiny fraction of new shares. In that instance, the old options were cash-settled. See the preliminary OCC notice (dated 9/21/2017) and the final OCC notice (dated 9/27/2017).

From the preliminary OCC notice:

Ocean Rig UDW Inc. (ORIG) has announced a 1-for-9200 reverse stock split/Scheme of Arrangement. As a result of the reverse stock split/Scheme of Arrangement, each ORIG Common Share will be converted into the right to receive approximately 0.0001087 (New) Ocean Rig UDW Inc. Common Shares. The reverse stock split will become effective before the market open on September 22, 2017. Cash will be paid in lieu of fractional ORIG shares

The cash in lieu amount was then determined ( and announced in the final OCC memo:

Adjusted Ocean Rig UDW Inc. options were adjusted on September 22, 2017 (See OCC Information Memo #41867). The new deliverable became cash in lieu of approximately 0.01087 fractional ORIG Shares. The settlement of the ORIG1 options exercise/assignment activity was subject to delayed settlement.

OCC has been informed that a price of $23.50 per whole ORIG share will be used to determine the cash in lieu amount at a rate of 0.01087.

Accordingly, the cash in lieu amount is:
0.01087 x $23.50 = $0.26 per ORIG1 Contract

Now that the exact cash in lieu amount has been determined, OCC will require Put exercisers and Call assignees, during the period of September 22, 2017 through September 27, 2017, to deliver the appropriate cash amount

I was told by an experienced trader that I trust that how the OCC determines settlement in these cases of corporate events is determined by the company — so when a similar situation happens in the future both the cash in lieu of settlement and the rounding of shares (up or down) are both possible.

For the record: some final charts of Seadrill during the bankruptcy:


And here is a final chart of Seadrill affiliate North Atlantic Drilling (NADLQ), whose shareholders were completely wiped out in the bankruptcy:

I did not short NADLQ because of the high borrow rate and low price and uncertainty about when the stock would be deleted.

And here is the Ocean Rig UDW (ORIG) chart showing the time during which it emerged from bankruptcy — it appears that the two daily candlesticks in the $700 range are data errors — the stock closed at $0.075 on the last day of trading prior to emergence from bankruptcy and the 9200 for 1 reverse split. It opened around $40 the next day (it actually opened above $100 but those trades were busted)

Here are charts showing the actual prices (with no apparent data errors):

Disclaimer. I am short a tiny position of SDRL July 20th 2018 $0.50 calls. No position in any other stock mentioned and I have no relationship with anyone mentioned in this post. This blog has a terms of use that is incorporated by reference into this post; you can find all my disclaimers and disclosures there as well.

An Introduction to shelf registrations

Probably the most common kind of way of issuing and registering new stocks is a shelf registration. This is filed on SEC Form S-3 (F-3 if the issuer is a foreign company). These can be used with multiple types of offerings, including most commonly PIPEs, Private Investments in Public Equities, where the shares have been sold to an investor and the shares are now being registered so that investor can sell those shares; ATMs or At the Market Offerings (PDF), where a company sells shares into the open market from time to time; and registration of shares underlying warrants or convertible bonds.

Shelf Takedowns by Greenberg Traurig (PDF)
FAQs about Shelf Offerings by Morrison Foerster (PDF)

Besides the actual shelf registration statement, the company has to file a prospectus supplement within two days of whichever comes first, the offering being priced or the shelf registration being used. Also, just because a shelf registration is filed does not mean it can be used immediately — the registration needs to be declared effective after the SEC reviews the registration. This typically takes two to three weeks from when the registration statement is filed. When a shelf registration (or another registration statement) has become effective a form EFFECT will be posted. For example, here is a shelf registration, prospectus, and EFFECT for Diana Containerships (DCIX):


Disclaimer. No position in any stocks mentioned and I have no relationship with anyone mentioned in this post. This blog has a terms of use that is incorporated by reference into this post; you can find all my disclaimers and disclosures there as well.

Excel Macro to run trade report on DAS Trader Pro trade log

I have been mucking about with some programming lately and I only just realized that the work I had been doing to get my average price on trades so I can enter it into my trade log was easily automated. The below Excel (2010 is the version I use) macro has made my life a little easier so I am sharing it here. This can be used with the ‘trade’ output of DAS Trader Pro (which I am currently using with Centerpoint Securities) but with slight changes could be used on the output from Sterling Trader Pro or other trading platforms. There are easier ways to get the summaries, but I make sure to record trades I make in my trade log with details including my trade plan and post-trade evaluation — most of the time I’ll put together all the trades in each ticker to save time and because I’m trading the stock with one strategy. So for my purposes I like having the average price (including fees) shown neatly.

First, start with how the data should be formatted prior to the macro working. Go to “Trade” in DAS Trader Pro and then click “Trades”. Select the columns and copy and paste into an Excel worksheet named “scratchpad” (and make sure to paste into column B). Then hit Control + A to select the entire range of data and run the macro (I have it hotkeyed on my computer to Control+P). This will create a new worksheet, run a pivot table, copy the pivot table data, delete the pivot table worksheet, and paste the pivot table data and price per share in an easy to read format in another new worksheet.

Here is how the data should be formatted in your trade report that you paste into Excel (you do not need a header row):

inputdata

And below is how the data will be output:

macro_output

Obviously, you can use this same basic code framework to get lots of other data easily (such as ECN fees, etc). The one thing this code will not do is account for per-trade fees. I don’t have them at Centerpoint (clearing through ETC) so I didn’t program them. Also, make sure you enter your per-share commission into the code. Use this code at your own risk — I provide it without warranty or support.

Warning: if you are a programmer you will find my code ugly. You have been warned.

Below is the code:

Sub DAStraderAvgPrices()

‘ DAStraderAvgPrices Macro
‘ For this to work you need to copy pasta the following columns from DAS into the ‘sheet ‘scratchpad’
‘Time | Ticker | Buy/Sell | Price | Shares | Route | ECN Fees | Amount of trade
‘Those columns all must be there in that order or it will mess lots of things up.
‘The trades must be pasted into column B and then select all the trade info ‘(control+A)

Dim myRange As Range
Dim i As Long
Dim HeaderRange As Range
Dim HeaderPasteRange As Range
Dim TopLeft As Range
Dim objTable As PivotTable
Dim objField As PivotField
Dim rng As Range
Dim ws1 As Worksheet
Dim pt As PivotTable
Dim rngPT As Range
Dim rngPTa As Range
Dim rngCopy As Range
Dim rngCopy2 As Range
Dim lRowTop As Long
Dim lRowsPT As Long
Dim lRowPage As Long
Dim PivotTableSheet As String
Dim celltxt As String

‘this is my commission rate
commission = 0.0035

Set myRange = Selection

‘sort by column C then D (ticker then buy/sell)
myRange.Sort Key1:=Columns(3), Order1:=xlAscending, Key2:=Columns(4) _
, Order2:=xlAscending, Header:=xlGuess, OrderCustom:=1, MatchCase:= _
False, Orientation:=xlTopToBottom
‘the above works! Yay!

‘this section calculates the cost basis (including ECN fees and commissions) of each fill
For i = myRange.Rows.Count To 1 Step -1
Set BuySell = myRange.Cells(i, 3)
If BuySell.Value = “B” Then
myRange.Cells(i, 8) = (myRange.Cells(i, 4) + commission) * myRange.Cells(i, 5) + myRange.Cells(i, 7)
ElseIf BuySell.Value = “S” Then
myRange.Cells(i, 8) = (myRange.Cells(i, 4) – commission) * myRange.Cells(i, 5) – myRange.Cells(i, 7)
ElseIf BuySell.Value = “SS” Then
myRange.Cells(i, 8) = (myRange.Cells(i, 4) – commission) * myRange.Cells(i, 5) – myRange.Cells(i, 7)
End If
Next i

‘Here we append the header row to the data
myRange.Cells(0, 1) = “Time”
myRange.Cells(0, 2) = “Ticker”
myRange.Cells(0, 3) = “Buy/Sell”
myRange.Cells(0, 4) = “Price”
myRange.Cells(0, 5) = “Shares”
myRange.Cells(0, 6) = “Route”
myRange.Cells(0, 7) = “ECN Fee”
myRange.Cells(0, 8) = “Amount”

‘Pivot table time!

‘only uncomment the following two lines when testing on specific region
‘ActiveWorkbook.Sheets(“scratchpad”).Select
‘Range(“B4”).Select

ActiveWorkbook.Sheets(“scratchpad”).Select
myRange.Cells(0, 1).Select

Set objTable = ActiveSheet.PivotTableWizard

Set objField = objTable.PivotFields(“Ticker”)
objField.Orientation = xlRowField
objField.Position = 1

Set objField = objTable.PivotFields(“Buy/Sell”)
objField.Orientation = xlRowField
objField.Position = 2

Set objField = objTable.PivotFields(“Shares”)
objField.Orientation = xlDataField
objField.Position = 1
objField.Function = xlSum
objField.NumberFormat = “##,###”

Set objField = objTable.PivotFields(“Amount”)
objField.Orientation = xlDataField
objField.Position = 2
objField.Function = xlSum
objField.NumberFormat = “##,###.##”

‘Pivot tables with multiple data fields have hidden field “data” —
‘adding the below line makes it display correctly
objTable.AddFields Array(“Ticker”, “Buy/Sell”), “Data”

‘Copy the Pivot table and paste it into a new worksheet as values
On Error Resume Next
Set pt = ActiveCell.PivotTable
Set rngPTa = pt.PageRange
‘On Error GoTo errHandler

PivotTableSheet = ActiveSheet.Name

‘If pt Is Nothing Then
‘ MsgBox “Could not copy pivot table for active cell”
‘ GoTo exitHandler
‘Else
Set rngPT = pt.TableRange1
lRowTop = rngPT.Rows(1).row
lRowsPT = rngPT.Rows.Count
Set ws1 = Worksheets.Add
Set rngCopy = rngPT.Resize(lRowsPT – 1)
Set rngCopy2 = rngPT.Rows(lRowsPT)

rngCopy.Copy Destination:=ws1.Cells(lRowTop, 1)
rngCopy2.Copy Destination:=ws1.Cells(lRowTop + lRowsPT – 1, 1)
‘End If

If Not rngPTa Is Nothing Then
lRowPage = rngPTa.Rows(1).row
rngPTa.Copy Destination:=ws1.Cells(lRowPage, 1)
End If

ws.Columns.AutoFit

‘Stopping Application Alerts
Application.DisplayAlerts = False

‘delete pivot table sheet
Sheets(PivotTableSheet).Delete

‘Add in some formatting and get price per share for buys/sells

Columns(“C:C”).ColumnWidth = 13.71
Columns(“D:D”).ColumnWidth = 14.86
Range(“G2”).Select
ActiveCell.FormulaR1C1 = “Price”
Columns(“G:G”).Select
Selection.NumberFormat = “0.0000”
Selection.ColumnWidth = 11.43
Range(“F3”).Select
ActiveCell.FormulaR1C1 = “=IF(ISBLANK(RC[-4]),””””,RC[-4])”
Range(“F3”).Select
Selection.AutoFill Destination:=Range(“F3:F197”), Type:=xlFillDefault
Range(“F3:F197”).Select
Range(“G3”).Select
ActiveCell.FormulaR1C1 = _
“=IF(ISBLANK(RC[-3]),””””,IF(ISBLANK(RC[-5]),””””,RC[-3]/RC[-4]))”
Range(“G3”).Select
Selection.AutoFill Destination:=Range(“G3:G202”), Type:=xlFillDefault

‘Loop through table to clear all rows that contain “Total”
Last = Cells(Rows.Count, “D”).End(xlUp).row
For i = Last To 1 Step -1
celltxt = Cells(i, “A”).Text
If InStr(1, celltxt, “Total”) Then
Cells(i, “A”).EntireRow.ClearContents ‘ USE THIS TO CLEAR CONTENTS BUT NOT DELETE ROW
End If
Next i

ActiveSheet.UsedRange.Select

exitHandler:
Exit Sub
errHandler:
MsgBox “Could not copy pivot table for active cell”
Resume exitHandler
End Sub


Disclaimer: I have no position in any stocks mentioned as of this post being published but I may trade them in the future. I am a client of Centerpoint Securities (clearing through ETC). I have no relationship with any other parties mentioned above. This blog has a terms of use that is incorporated by reference into this post; you can find all my disclaimers and disclosures there as well.

2011 Super-mega-ultra pump and dump recap

I haven’t done any posts like this so far this year so I am going pretty far back. Please remind me in the comments of any big pumps I forget  and I’ll add them. See my last pump and dump recap from January to see some mailer pumps from the very beginning of the year.

Mailer Pumps

SPLM – $400k snail mail pump. See an image of the disclaimer here. The last part of the disclaimer is the most interesting: “”In order to enhance public awareness of Sentry Petroleum Ltd., and other companies profiled by WER [World Energy Report] through the distribution of this report, ECA [Energy Capital Advisors] paid WER four hundred thousand dollars. These funds were applied towards costs associated with creating, printing, and distributing this report. ECA will pay no additional sums. WER, ECA, and those associated with them may own shares and effect transactions in securities of Sentry Petroleum Ltd and other companies mentioned in this publication the sale of which could adversely affect the share price. The owner of ECA owns approximately zero point two six (0.36) percent of the outstanding shares Sentry Petroleum Ltd [sic] and will not sell any of those shares within ninety days of the date of this mailing.” [emphasis mine]


KNKT – $800k pump from Capital Financial Media (CFM). See post here (unfortunately the pump website is offline).

UTOG – $2.5m mailer pump. Trading was suspended by the SEC for two weeks at the beginning of June (a rare case where the SEC suspended trading in an active pump & dump). See website www.AmericanEnergyReport.com Disclaimer: “AmericanEnergyReport.com has been retained by an unrelated third party to perform promotional and advertising services intended to increase investor awareness of UnionTown Energy Inc. (UTOG). To date, AmericanEnergyReport.com has received two million five hundred thousand US dollars from an unrelated third party for performing these services. The services performed have included profiling the company on the AmericanEnergyReport.com website and issuing opinions concerning UTOG in newsletters and press releases. AmericanEnergyReport.com has received this amount as a production budget for advertising efforts and will retain amounts over and above the cost of production, copywriting services, mailing and other distribution expenses as a fee for our services. In addition AmericanEnergyReport.com expects to receive an additional two million dollars cash in future compensation for the continuation of the marketing program for an additional 3 months and to cover marketing vendors to pay for the costs of creating and distributing this report online in an effort to build market awareness, and AmericanEnergyReport.com will disclose any future compensation.”


LEXG – The greatest pump I have ever seen and probably one of the best ever. Note not just the price movement but the incredible volume — the value of stock traded on its last big up day exceeded $100m. This had a $3.29m budget disclaimed on these two websites: http://www.smauthority.com/video and http://www.thestockdetective.com/lexg/

Disclaimer: “Lithium Exploration Group, (LEXG), the company featured in this issue, appears as paid advertising, paid by Gekko Industries to provide public awareness for LEXG. … CM [Circuit Media] has received and managed a total production budget of $3,296,800 for this advertising effort and will retain any amounts over and above the cost of production, copywriting services, mailing and other distribution expenses, as a fee for its services. TSD [TheStockDetective] is paid $50,000 as an editorial fee from CM and also expects to receive new subscribers as a result of this advertising effort.”

Please note that unlike most of the stock charts on this page, the chart below is not log scale, to make seeing the price action during the pumps easier to see.

JAMN – An incredibly successful pump, the second most successful pump I have ever seen, after LEXG. This was pumped by HackTheStockMarket.com; see the pump page here (or here or here). The name and address information required by the CAN-SPAM law from this pumper changed multiple times, which leads me to believe it was all fake. HackTheStockMarket disclosed only $15,500 in payment for the promotion. The disclaimer was an image that is shown below.

Please note that unlike most of the stock charts on this page, the chart below is not log scale, to make seeing the price action during the pumps easier to see.

AVVC – $1.8m budget disclosed on this mailer pump. Lots of speculators / traders / idiots lost big going long on this stock — it was the first big pump failure following a string of very successful pumps early this year. Disclaimer: “CFM has received and managed a total production budget of $1,800,000 for this online advertising effort and will retain any amounts over and above the cost of production, copywriting services, mailing and other distribution expenses, as a fee for its services. Breakaway Stocks is paid $5,000 as an editorial fee from CFM and also expects to receive new subscriber revenue as a result of this advertising effort.” from this website.

LOGL – $1.275m mailer pump — see the SI pump mailer message board.

TBBC –  This was a large pump from multiple sources with over $800,000 in compensation. Following are those that I can find:

“Charles Payne’s Common Sense Newsletter received forty thousand dollars, as an editorial fee, from Creative Direct Marketing Group, Inc., which it received from the featured Company. This company was chosen to be profiled after Charles Payne’s Common Sense Newsletter completed due diligence on the company. Charles Payne’s Common Sense Newsletter expects to generate revenue and new newsletter subscribers and valuable exposure, the amount of which is unknown at this time, resulting from the distribution of this report. Creative Direct Marketing Group, Inc. received fifteen thousand, eight hundred dollars from the Company, for the costs of creating and distributing this report in an effort to build investor awareness.” from this pump website

“StockMarketLife.com has been retained by an unrelated third party whose principal is a shareholder of the featured company, The Brainy Brands Company Inc. (TBBC), to perform promotional and advertising services intended to increase investor awareness of TBBC. StockMarketLife.com expects to receive up to six hundred thousand US dollars from the unrelated third party for performing these services. The services performed have included profiling the company on the StockMarketLife.com website and issuing opinions, including Charles Payne’s report, concerning TBBC on this website, online marketing, in newsletters and press releases. StockMarketLife.com has received this amount as a production budget for advertising efforts and will retain amounts over and above the cost of the production, copywriting services, mailing, media buying and other online distribution expenses as a fee for our services.” This disclaimer was also in emails from GreenGainers.com and PowerPennyStocks.com, which all appear to be run by the same person/company.

“PennyStockRewards.com is a wholly owned subsidiary of Asset Development Strategies Corp.  Currently Asset Development Strategies Corp. has been compensated $50000.00 for this advertising program from a non-affiliated third party shareholder who will be selling stock in TBBC.”

WallStreetPennyStockAdvisors.com received $200,000


RYUN – I am not sure of the details of this pump.

AAGC – $1.26m budget disclosed. Absolute destruction. Michael Williams Market Movers was paid $20,000 by Citiglory Consultants Ltd and Citiglory paid $1,265,178 for the cost of the promotion — due to website troubles I lost my copy of the disclaimer (the bastards had it as an image that I had saved). See the online version of the mailer (no longer working).

TKDN – $1.4m budget disclosed. Absolute destruction. Disclaimer: “CFM has received and managed a total production budget of $1,400,000 for this online advertising effort and will retain any amounts over and above the cost of production, copywriting services, mailing and other distribution expenses, as a fee for its services. M3 Profit Accelerator is paid $3,000 as an editorial fee from CFM and also expects to receive new subscriber revenue as a result of this advertising effort.” (CFM = Capital Financial Media). See the online version of the mailer at SmallCapFortunes

TKDN is an even more impressive dump when considered over nine months (hardly the long-term!) it dropped from a high of about $1.34 to a low of $0.006 — a drop of 99.55%.

Note: on 12/19/2011 the pumps in this post run by the big three email pumpers were removed to a GoodeTrades Premium post and more info on those pumps was added.

Disclaimer: No positions. This blog has a terms of use that is incorporated by reference into this post; you can find all my disclaimers and disclosures there as well.


Boxing your shorts: Why I could short TNGS when almost no one else could

One of the problems with a lot of pump and dumps is that there are often not any shares to short when the stock is about to fall. However, there are often shares available to short days before, when the pump is just starting. For example, there were at least 5,000 shares per day of TNGS available to short at Interactive Brokers for many days prior to its big drop day. However, from January 19th (the day before its big drop) to January 21st (the 2nd big drop day) there were no shares available to short at Interactive Brokers. Below is a chart from Interactive brokers showing the share availability to short of TNGS.

So what can a short seller do? The simple answer is to box the shares (this is also referred to as simply boxing). Boxing originated as a tax technique designed to delay the realization of capital gains while eliminating the risk of holding a stock. So for example an investor who was long 1,000 shares of AAPL since 1990 would then go short against the box, selling short an equal number of shares either in the same account (some brokers let you do this) or in another account, if he believed the stock was temporarily overvalued. This eliminated the risk of holding AAPL stock and did not require realizing a huge taxable capital gain. This tax loophole was closed in 1997. Now the only reason to box shares is to lock up short shares.

What I do on many pumps (the ones I know I will want to short sell) is I short shares at Interactive Brokers while going long an equal number of shares at SpeedTrader. Sometimes I will already be long the stock as I do sometimes try to make money by buying pumps (but shorting is much easier). Other times I will scalp to open the boxed position (for example I might scalp short and then buy long in my other account to box, rather than covering). By boxing the shares I accomplish two things: (1) I can now short whenever I want by selling my long shares, even long after no new shares are available to short, and (2) I can get better fills when I do decide to short an OTC stock because Speedtrader has more direct-routing options than does IB.

So how did I implement this for pump TNGS? I shorted 3000 shares at Interactive Brokers at an average price of $2.51 on 1/14 (that I later covered at $2.096 on 1/20 and 1/21). The same day, I bought 3000 shares in my Speedtrader account (I think I actually ended up buying for poor scalps multiple times, which explains why my average buy price is so much higher than my average short, and why Profit.ly has the position size at 4900 shares).

To get net short on 1/19 when TNGS was looking weak and I thought it might drop, I sold my long shares at Speedtrader, and I rebought them when TNGS held up (again, I had partial fills and some scalping so Profit.ly shows more than 3000 shares). On 1/20, soon after the open, TNGS looked weak and actually went red on the day. I shorted then by selling my long shares and I bought them back for a loss. When it went red again just a little bit later I believed it was time for the death drop and I sold my long shares a final time (2500 at $2.83 and 500 at $2.85). To cover, later that day and the next day, I covered my short shares at IB. I covered 2,000 shares on 1/20 at an average price of about $2.16; IB bought in 800 of my remaining shares at 2.05 the next morning, and I covered the last 200 shares into the 2nd down day morning panic at $1.64. Overall I netted $1913.21 from my trades on TNGS. Even considering the total capital I needed to make these trades (6,000 shares * a maximum price of $2.89 = $17,340), my percentage return was nice (11.0%).

There are of course downsides  to boxing. It uses up capital (and if you aren’t careful you can generate a margin call in one account even though you are not losing money overall), generally requires multiple brokerage accounts, generates more commissions, and requires more planning than just shorting. That being said, as long as the net result is a profit on a stock that would not have been otherwise shortable when you wanted to short it, the end result makes the hassle worthwhile. The only risk to boxing is forced buy-ins of short positions. This actually happened to a couple traders I know who had boxed shares of TNGS in preparation for its big down day. One of those traders was forced by Interactive Brokers to cover his short shares right at the open on 1/20, just an hour before the stock dropped. However, being forced to cover part of a boxed position will only saddle a trader with the costs of commissions and slippage.

A note on the psychology of boxing: I have seen other traders refer to ‘making money’ on one side of a boxed position while ‘losing money’ on the other side. I do not think of it like that. If I am long the same number of shares I am short, I have no net position and no risk. I consider myself ‘flat’ and think about it as if I had no positions in the stock. I then consider myself to be shorting when I sell my long shares.

2nd Down day intraday 1-minute chart

Disclosure: Short 40,000 shares of CWNR at Interactive Brokers and long 40,000 shares of CWNR at SpeedTrader. No positions in any other stocks mentioned. This blog has a terms of use that is incorporated by reference into this post; you can find all my disclaimers and disclosures there as well.

BestDamnTradeRecap dot Com!

Not a full trade recap, but just my recap of BestDamnPennyStocks (and all their other websites) re-pump of CWNR.

Profit on CWNR: $5,066.31 (my other trades netted me additional profit but I didn’t want to take the time to discuss them)

Disclosure: Short 2,000 shares of CWNR. No positions in any other stocks mentioned. This blog has a terms of use that is incorporated by reference into this post; you can find all my disclaimers and disclosures there as well.

Trade recap for the new year: Some lessons learned

A good start to the new year. I wanted to commemorate the CPOW chart and my thoughts on it; I am still on my blogcation so don’t expect this every day!

All trades today:

SLD 20,000 CPOW false Stock 0.330 USD SMART 09:30:23 33.00 null
+ SLD 20,000 CPOW false Stock .330 USD SMART 09:30:39 33.00 null
BOT 5,000 CPOW false Stock 0.305 USD SMART 09:32:43 7.62 null
BOT 5,000 CPOW false Stock 0.291 USD SMART 09:34:47 7.28 null
BOT 5,000 CPOW false Stock 0.290 USD SMART 09:34:59 7.25 null
BOT 5,000 CPOW false Stock 0.280 USD SMART 09:37:00 7.00 null
+ BOT 10,000 CPOW false Stock .279 USD SMART 09:37:55 13.94 null
BOT 5,000 CPOW false Stock 0.279 USD SMART 09:37:55 6.98 null
+ BOT 5,000 CPOW false Stock .280 USD SMART 09:40:01 6.99 null
SLD 10,000 MDMN false Stock 0.1425 USD SMART 09:50:52 7.12 null
+ SLD 11,427 MDMN false Stock .143 USD SMART 09:50:54 8.16 null
+ SLD 20,000 MDMN false Stock .142 USD SMART 09:50:54 14.20 null
BOT 11,427 MDMN false Stock 0.1276 USD SMART 09:53:27 7.29 null
BOT 5,000 MDMN false Stock 0.1320 USD SMART 09:58:11 3.30 null
+ BOT 10,000 MDMN false Stock .131 USD SMART 09:58:12 6.55 null
BOT 5,000 MDMN false Stock 0.1379 USD SMART 10:03:11 3.45 null
+ BOT 8,000 MDMN false Stock .136 USD SMART 10:03:13 5.43 null
BOT 2,000 MDMN false Stock 0.1379 USD SMART 10:03:13 1.38 null

10:41:48 ENHD B 0.6301 1000 SBSH

10:51:09 ENHD S 0.7401 1000 ARCA

14:26:08 CPOW B 0.2052 10000 UBSS

14:28:15 CPOW S 0.2099 6000 UBSS

14:28:33 CPOW S 0.2095 4000 NITE

14:52:40 CHGS SS 4.25 100 SMART

14:52:42 CHGS SS 4.25 500 SMART

14:52:42 CHGS SS 4.25 400 SMART

15:25:25 CHGS B 4.04 200 SMART

15:25:25 CHGS B 4.04 800 SMART

Daily profit: $2,334.01

Disclosure: No positions in any stocks mentioned. This blog has a terms of use that is incorporated by reference into this post; you can find all my disclaimers and disclosures there as well.

I no longer recommend InvestorsUnderground.com stock chat

My InvestorsUnderground affiliate link redirects to this page. I stopped using InvestorsUnderground stock chat in December 2010 and I stopped recommending the chat at the same time. I do not recommend products or services that I do not use. This should not be considered a recommendation against IU chat — I simply don’t know enough to have an opinion anymore.

My old affiliate link now redirects to this page.

[Post updated 7 November 2018]

Disclosure: I used to be an affiliate of InvestorsUnderground (IU) stock chat, for which I received 50% of a new subscriber’s first month’s payment and 25% on an ongoing basis. I have not received any affiliate payments from them since December 2010. I am no longer a member of InvestorsUnderground stock chat; my membership ended at the end of 2010. I had subscribed to IU since its inception at the beginning of 2009 and I paid the standard rate of membership for charter members, which was $99/quarter (I also was a member of the free predecessor chat, Green on the Screen, for 6 months starting in summer 2008). From 2009 through 2010, I received a total of $5,720.39 (net of Paypal fees) from Pietro Rossa Trading (the Nevada corporation through which Nate Michaud runs InvestorsUnderground). This blog has a terms of use that is incorporated by reference into this post; you can find all my disclaimers and disclosures there as well.

Trade recap for December 21st: A missed bounce play

Nothing too exciting today except for a missed opportunity on a bounce play.

Daily profit: $176.32

Disclosure: No positions in any stocks mentioned. This blog has a terms of use that is incorporated by reference into this post; you can find all my disclaimers and disclosures there as well.