Youtube video. I discuss why you aren’t as smart as you may think you are and why beating the market is so hard.
P/E Ratios: Part 2
In a previous post, I discussed how to find the appropriate P/E ratio of a company based on current earnings and I gave a rough estimate for appropriate P/E ratios if the company’s earnings are increasing or if they are decreasing. In this article, I will address historical average P/E ratios in the stock market.
Please take a look at the graph of historical PE ratios vs. the price of the DJIA over the last 100 years. The most obvious conclusion we can draw from the chart is that there are distinct cycles in the market: bear markets with decreasing P/E ratios are followed by bull markets and increasing P/E ratios. Another obvious fact we can see is that for most of its history, the average P/E on the S&P 500 has been between 10 and 20. Also, the stock market’s returns have been greatest following periods of low P/E ratios than in periods following high P/E ratios.
Unfortunately, these trends do not bode well for our near-term performance. There are two likely possibilities in the near term (5-10 years): stock prices will fall, perhaps precipitously, or stock prices will neither fall nor rise. In the first case, P/E ratios would also fall quickly, and by the time they fall to about 10 on average, we would want to be fully invested. In the second case, P/E ratios will gradually decline as profits increase but stock prices go nowhere.
I am not an expert on forecasting the future, but there are forecasters who predict both of the above possibilities. John Mauldin, in his book Bullseye Investing (an excellent book by the way), predicts what he calls a ‘muddle-through economy.’ Mauldin sends out a free weekly newsletter to which everyone should subscribe.
Richard Russell, on the other hand, in keeping with Dow Theory, argues for a standard bear market with falling stock prices. Russell, by the way, is ranked as the second best market-timer by Mark Hulbert since 1980. The best market timer is a system based solely on the date.
Anyway, future stock returns do not look good at this point, at least for the averages. If we look at individual stocks, though, there are still some that are good values. Unfortunately, that list is small, and I can find few great values. Even if the market goes against us (or does not move at all), we can do fine. I do not think that we should anticipate average returns exceeding 10% per year over these next few years. That being said, an overvalued market is a stockpicker’s market. Whereas Sir John Templeton could buy 100 cheap European stocks in 1939, including many in bankruptcy, and make fabulous profits on almost all, we will have to pick and choose carefully. There are still companies that are undervalued, with a potential for giving us outsized profit.
As investors concerned with value, we must remind ourselves that a bear market is a good thing. This is where time diversification benefits us. As stock prices fall (or, as they do not move but profits increase), and P/E ratios fall, we must gradually increase our allocation of assets to stocks. Thus, as value gradually returns to the market, we should gradually sell bonds (or use cash) to buy more stocks.
I am not a market timer. I can think of very few times when it actually made sense to be out of the market. In 1929 it would have been advisable. But in 1937, 1966, and 2000 there were still some fairly valued stocks. For example, we would have been fine buying Sysco [[SYY]] in 2000, but not Cisco [[CSCO]].
Disclosure: I own no shares in any of the companies mentioned. See the disclosure policy.
[This was originally published October 2005 . The market’s performance since then validates my belief that market timing is not worth the effort.]
P/E Ratios: Part 1
What is a good P/E ratio? Well, good P/E ratios are low. But how low is low enough? Is 20 good? Is 15 good? There are a couple ways to look at this–in terms of a business in general, and in terms of what the markets have determined to be an average P/E in the past. I address historical P/E ratios in the stock market in a future post.
Let’s say you own Acme Brick, and your company makes an average profit of $1 million per year. As the owner, you can pay that to yourself or reinvest it in the business. Let’s say you want to sell, though. What is a fair value? To do this, you need to compare the return that you would make on your business relative to the risk-free interest rate (the rate of interest that you could earn on a U.S. government bond). The rate is now about 5%.
The person to whom you are selling Acme Brick should (at a fair selling price) be able to make a somewhat better return on his money than if he just bought government bonds. This is because he is taking on more risk in buying a company than he would be if he bought government bonds. The company may see its profits shrink, whereas the return on a government bond is guaranteed. So we then fire up a handy interest rate calculator and learn that at 5% interest, it takes about 14 years to double your money.
So what price would a buyer of Acme Brick have to pay so that it would take him 14 years to double his money? He would have to pay $14 million dollars. (In 14 years, his $1 million per year profit would have doubled his original investment to a value of $36 million, including both the company and cash.) I must note that it would actually take less than 14 years for Acme Brick to double the initial investment, because when earnings are paid out each year, they can be invested elsewhere and will thus compound, just like interest on a bond compounds.
Because there is more risk in Acme Brick than in the U.S. government, $14 million is too high, so we subtract some money from his buying price to compensate the buyer for his risk. Therefore, about $10-12 million should be a fair price for buyer and seller. This price translates to a P/E ratio of 10-12. So is this the fair P/E ratio of all businesses? No. In our example, we assume Acme is not growing more profitable. If the company is growing its profits rapidly, a higher price would be in order. However, if the company is becoming less profitable, a much lower price is in order. But the price is always determined from the future profits we can expect from the company. When we take into account the other possible uses of our money, such as buying government bonds, what we have done is an over-simplified discounted cash flow analysis (only the really courageous should follow that link). Again, this is simplified, but the future introduces so much uncertainty that more precise calculations are rarely helpful.
So, with current interest rates very low (around 5% for medium-term government bonds), a fair P/E for a company that is not growing more profitable is about 12. We don’t want to buy companies when they are fairly valued. We want to buy them when they are good values or great values. Thus, for companies that do not show strong growth, we will prefer to pay less than $9 for every $1 in earnings (or, a P/E ratio of 9). For companies with strong growth, we may be willing to pay up to around a P/E of 20 (although the lower, the better).
By paying less than the fair value, we give ourselves a margin of safety, so that we are protected in case we make a mistake in our calculations or in case the company in which we are investing suddenly starts to do worse. Half the battle of making money in the stock market is avoiding big losses, so in buying great values, we are halfway to success.
Bad Investment Advice
I’ll take a break from disparaging penny stocks and fraud to discuss some hyped up claims of certain investment services.
The first ‘victim’ (I put that in quotes because everyone listed deserves to be excoriated) is Doug Casey (or Dave Forest, who is listed as the managing editor of the Casey Energy Speculator). This advertisement I received in the mail receives my ‘duh’ award. Is it not amazing that some of his picks have been up 570% (Cameco), 1500% (International Uranium), or 1000% (Strathmore Resources)? It would be, until we realize that the newsletter in question specializes in energy. Even a chimpanzee specializing in energy stocks, picking them randomly, could have easily compiled a similar short list of stocks with great returns, simply because we have been in an energy bull market these past few years.
Some might argue that point, saying that at least they knew to invest in energy. That is not the case–the newsletter has been around for awhile, so that is simply their specialty. But what if they predicted this energy bull market back in the late 1990s? Since they are specialized, they have to believe that their specialty will do well. In other words, no specialized newsletter can succeed if the author does not believe that his area will do well. Therefore, specialty newsletters, whether they be in technology or energy, will attract perma-bulls. Those that become bearish will leave the specialty or the field.
So do I think Dave Forest is an idiot? No. He may be brilliant. I simply do not know. In fact, if one had invested only in energy for the past 20 years, one would have done very well. That being said, a specialist in energy is in no place to say whether energy is a better investment now then real estate or chemicals. His expertise in one area will prevent him from impartially considering which industries will do better or worse than his own specialty. So if you do subscribe to a specialized investment newsletter or service, be wary of any claims about anything but that newsletter’s specialty. Also, make sure to diversify into other industries as well.
Okay, so Doug Casey is not exactly a charlatan. At worst, his newsletter was guilty of exaggerated advertising claims. Let’s move onward and upward to criticize worse investment advice. This time, let’s play with options.
If you do not know what an option is, then let me first tell you: do not use them. That being said, if you wish to learn more, then visit Investopedia’s article on options.
Now before I start with my rant, I will regal you with my analogical abilities. Let us say that you and I have a bet on who will win the Superbowl next year. I bet on the Chicago Bears; you bet on everyone else. Because the odds of some team other than the bears winning are so good, I will get a large payout should the Bears win (say, $100). However, should any other team win, you get a small payout (say, $1). Now, let us suppose that I am really sure the Bears will win. Why not increase my bet by 10 times? Then if they win I’ll make ten times as much, and if they lose I lose only a little? That is how leverage works–it does not change the odds of winning or losing, but increases the possible losses and gains.
In the above analogy, I am like a buyer of an option, whereas you are like the seller (writer). The buyer pays a small amount of money, has a relatively low chance of winning, but will generally make much money if he is right. The seller is almost certain of being paid a small amount of money, but has the risk of losing a whole lot more.
When looking at actual stock options, it is important to realize that the sellers are mostly divided into two types: one type is the arbitrage seller or market maker, which is only interested in making a small, guaranteed profit (basically, their profit amounts to a fee for the service of writing the option the buyer wants). These sellers will always take the opposite side of their bet in the stock market, so they do not have any risk. If this is above you, do not worry–the important thing to realize is that no matter what, they make a small profit. The other types of options sellers are in it to profit from superior knowledge. They are usually quite smart and experienced. In fact, they have to be, since their risk is huge if they miscalculate. For example, Richard Russell has a side business selling options.
The vast majority of options that are bought expire worthless. Keep that in mind as you read on about THE BULL MARKET THAT NEVER ENDS! That is what the advertisement for the Mt. Vernon Options Club screamed at me. Steve McDonald, I have to say, is either an idiot or a charlatan.
I will explain the common idiocy of covered calls a bit later, but first I have to take umbrage with his winning LEAP strategy with Chesapeake Energy (CHK). He recommended buying a $12.50 call option (option to buy) when the stock was below $10. Smart move. The next move was not so smart: he recommended selling the $15 call option. While this turned out okay, what this did was remove any possible gains should the stock continue to appreciate, while the downside risk was still present. What is even more amusing about this example is that for a heck of a lot less risk, an investor could have simply bought the CHK shares at $10 per share, and would now have a 300% profit!
Next up on my list of charlatans is Bernie Schaeffer, of Schaeffer Investment Research. Now, I have subscribed to his Options Advisor newsletter and found it to be okay–I did not lose much money. Of course, I did not pay for it–my brokerage gave me the subscription for free to try to increase my trading. (The long term record of the newsletter, according to Mark Hulbert, is horrid, though–an average annual loss of 4.7% per year for over 20 years, during the greatest bull market in history.) Besides a horrid track record, why do I suddenly call Bernie a charlatan? I do this simply because he leaves me no choice: his most recent actions have proven that he has no respect for his subscribers. He decided to offer a covered-call options newsletter for the low price of only $795 per year! What a great deal! So why do I not like covered calls?
A covered call is simply writing (selling) a call option when you own the underlying shares of stock. With a covered call, you benefit if the stock does nothing or goes up a little, and you lose when it goes down a bunch. Hmm, that sounds an awful lot like selling a put option! Wait, umm, yes–it is! A covered call is mathematically equivalent to selling a put. The only differences between the two are that with a covered call, you receive any dividends that the stock pays, and you pay twice as many commissions to your stock broker. Also, a put has more leverage. To be truly equivalent to writing a put, a covered call writer would have to have a lot of margin.
Would the dividends make the covered call strategy more effective than simply selling puts? Maybe if the stock pays a large dividend, but it turns out that stocks that pay large dividends are either not very volatile, reducing the payment you would receive for selling the call (such as utilities and REITs), or they are smaller or thinly traded, meaning that there is no market for the options. So that is not generally a good reason to use covered calls. The only good reason I can think of is in the case of large institutions that perhaps become short-term bearish on a stock, but cannot exit a large position in that stock without depressing its price. In that case, selling covered calls may make sense.
So why do so many advisors recommend covered calls? They do this simply because it is much easier to qualify (with a stock broker) to sell covered calls than to sell puts. In other words, they give this advice because there are plenty of fools who can take it. Shame on them.
Okay, now it is time for the worst investment advice of the day! I will now debunk the art (do not dare call it a science) of what I call squiggles, or chart analysis. At the very least I will debunk post-hoc model development and back-testing.
What is chart analysis? Simply put, it derives from the idea that everything that is known about a stock is evident in the price action of that stock. Therefore, certain types of price action (certain chart patterns) should predict certain near-term outcomes. At some level, this is quite logical. For example, as William O’Neil emphasizes with his CANSLIM stock trading method, big increases in the price of a stock are often caused by big money (institutional investors) buying that stock. Therefore, seeing a series of days in a short period of time during which the stock is up on very high volume would be a good indicator that a big mutual fund has started buying.
I have problems with technical analysis in general and charting specifically, because too often those who engage in it either do things wrong or they give themselves too much leeway, by saying “it may go up, but if this happens and it goes down, then it may go down some more,” or similar things. However, that is not the purpose of this article. The problems with charting I mention here are egregious and are not problems of the best technical analysts.
In the advertisement for The Options Optimizer, there are plenty of great examples of how much money could have been made using the system. There are pretty graphs of the prices of commodities and stocks with arrows saying “sell” right before a big price decrease or “buy” right before a big price increase. There are statistics of all the millions of dollars that you could have made by following this system on these occasions.
There is only one problem with this. Nobody made any profits using this system. Every single example is a hypothetical example of trades the system would have chosen. What’s wrong with this? In statistical terms, selection. It is incredibly easy to examine past results of any strategy, no matter how bad, and find some examples where the strategy worked. In fact, your strategy could be as simple as selling companies whose names begin with vowels on Mondays and buying them on Fridays while doing the opposite with companies whose names begin with consonants.
Amazingly, this strategy would work about half the time; the results in any given week will be randomly determined. When you later start your investment newsletter a year later, you can give hundreds of examples where your system worked beautifully. Just ‘forget’ to give any examples of when your system failed and you will be on the road to riches.
A second problem with many trading strategies that is also a problem with the Options Optimizer is that it suffers from over-optimization. Here is an example not from investing: let’s say I have an algorithm for predicting college grades from SAT scores. It is only correct about 60% of the time (which is nevertheless good). I want it to be better. So I use my sample of past students and I look at other factors. I throw in high-school grades, ethnicity, and a measure of the difficulty of their high-school curriculum. All these are logical predictors of college grades. However, I am still only correct 70% of the time. I look back through my data and find that when I factor in eye color, waist size, length of name, and number of vowels in the last name my predicative power increases to 95%.
The problem comes when I use this new algorithm on a new sample. I suddenly find that its predicative power has fallen below 50%. Where did I go wrong? Simply put, I optimized the algorithm for a specific group and I included many variables that most likely have no effect on college grades. This is called over-optimization. If you include enough variables, you can develop a system that is right 100% of the time for the sample from which it was developed. For all other samples (of students or periods of time in the stock market) the system will be very bad. Thus, any successful trading system should have as few variables as possible so that it can be effective with wildly different samples.
So what can you do to protect yourself from these problems? The simplest answer would be to stick to a simple, effective, proven investment strategy (such as value investing). If you wish to take large risks and probably lose money, then at least make sure that any ‘trading’ system you use has actually been used profitably by someone.
Disclosure: Net, I have made money buying and selling options. I do not subscribe to any of the services I mention above. I used to subscribe to Ricard Russell’s newsletter, and I enjoyed reading it, but I stopped because it was too expensive. I own CHK. I have a disclosure policy.
SEC Gives Alleged Stock Manipulators Slap on Wrist
In this recent final judgment, issued yesterday (September 17, 2007), the SEC revealed what is wrong with its enforcement efforts against penny stock manipulators. There was no punitive fine; the accused were only required to give up their profits. This was despite the “egregious nature” of the offenses. If I were to steal $100 from my neighbor I would be ordered to pay restitution plus a fine (often larger than the restitution), and yet these people allegedly stole hundreds of thousands of dollars and they paid no penalty besides giving up their ill-gotten gains and promising not to do it again.
“The Court ordered Barnwell to disgorge $31,700 and prejudgment interest thereon. Casias was ordered to disgorge $334,097. Keener was ordered to disgorge $162,000 and was permanently barred him from acting as an officer or director of any publicly traded company. The Court did not order penalties.”
Disclosure: I believe that the SEC is incompetent. I have never committed fraud or any other securities violations.
Why I Investigate Penny Stocks
Some may wonder why I investigate and write about penny stocks so aggressively. I have been accused of pursuing this line of research simply to make myself look good so that I can feel important. I do not think that is the case because, as those who know me will attest, I always feel important. In fact, I have occasionally been accused of being a bit of an egotist.
Others may believe that my sole purpose in investigating over-the-counter stocks is to enrich myself for short selling. I do not deny that I make money by selling short OTC stocks. I do not, however, write about all the stocks that short, nor do I short all the stocks about which I write. I started writing about OTC stocks before I even knew that it was possible to short sell them. And I am not convinced that my commentary on the stocks about which I write has any effect on the market price.
The main reason I like to write about penny stocks is because I feel that I can offer something (independent, if not unbiased research) on companies for which there is little information available. Perhaps in writing about such companies I can persuade a few people to avoid speculating in such companies and to choose more appropriate and more profitable investments. It was only with substantial research and a bit of luck that I myself avoided losing a lot of money in a pink sheet stock 2.5 years ago, when I first started investing in individual stocks. If I had not chanced upon some pretty amazing negative information from the CEO’s past business deals, I could easily have lost 99% of the money I would have put into that company.
If you invest in anything, you should always do your due diligence. Do not believe that just because a company is publicly traded (or even because it is listed on the stock exchange) that it is a worthy investment or even a legitimate investment. If I had relied upon the SEC to protect me when I was considering investing in a penny stock, I would have watched 75% of my money vanish in a fraud and would not feel vindicated when four months later the SEC sued the company (US Windfarming, USWF.pk) and its CEO.
Disclosure: I have no position in any stock mentioned. See my disclosure policy.
Continental Fuels: The Most Overvalued Penny Stock I’ve Ever Seen
It is Not Fraud if There are No Lies
Dictionary.com defines fraud as “deceit, trickery, sharp practice, or breach of confidence, perpetrated for profit or to gain some unfair or dishonest advantage.” It has been more succinctly defined as “implicit theft” by Murray Rothbard, among others. The key to fraud is that deception leads to the deceiver gaining economically in a direct transaction with the deceived. Many unlisted penny stocks toe the line on fraud. Management, getting paid large salaries (and tons of stock options) despite crummy financial performance, hypes up the stock, always offering overoptimistic predictions of future performance. Oftentimes management pays ‘independent’ analysts large sums to cover the company. This leads to gullible investors paying out large sums for the stock. When management’s glowing predictions are later belied by stark reality, the investors lose their socks and the executives live happily ever after.
What would happen if management of a worthless penny stock were completely honest about how worthless the company truly was? In that case, there would be no fraud, but anyone buying the stock would be an utter fool. I found a company like this: Continental Fuels (OTC BB: CFUL.ob, $1.70). As of August 13, the company had 571.6 million fully diluted shares outstanding. That gives the company a market cap of $972 million. What do investors get for that $972 million? Not much. They get total assets of $3.8 million, a stockholder’s deficit of $1.1 million, and for the most recent quarter, sales of $5.7 million and an operating loss of $560k. (See the 10Q for the quarter ended June 30, 2007 for details.)
First, I should detail the shares outstanding–this is a tricky computation giving all that the company has done with its shares. To save space I will only discuss the origins of 500 million (88%) of the shares. There is convertible preferred voting stock that is convertible into 500 million shares. This was issued to UNIVERSAL PROPERTY DEVELOPMENT AND ACQUISITION CORPORATION (OTC BB: UPDA.ob) in payment for some assets. From the 10Q:
On April 23, 2007, the Company closed a business combination transaction pursuant to a Stock Purchase Agreement dated April 20, 2007, by and among the Company and Universal Property Development and Acquisition Corporation (“UPDA”), a publicly held Nevada corporation (the “SPA”). Pursuant to the SPA, the Company acquired one hundred percent (100%) of the capital stock of US Petroleum Depot, Inc. and Continental Trading Enterprizes, Inc. f/k/a UPDA Texas Trading (the “Subsidiaries”), two private Nevada Corporations and wholly-owned subsidiaries of UPDA. The consideration paid by the Company for the Subsidiaries consisted of $2,500,000 in cash, payable within 30 days of the Effective Date, and 50,000 shares of our Series A Convertible Preferred Stock valued at $5,000,000 (the “Preferred Stock”). The Preferred Stock is currently convertible into 500,000,000 shares of our common stock and UPDA has the right to vote the shares of Preferred Stock on an “as converted” basis in any matters for which the holders of our common stock are entitled to vote.
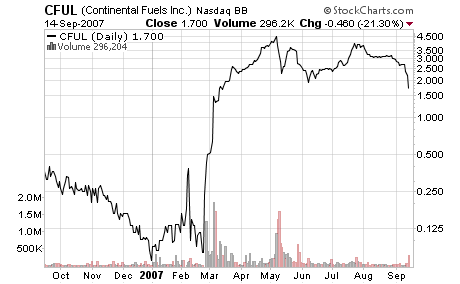
Valuation
Now comes the fun part. Continental Fuels, its 88% owner UPDA, and major shareholders of the two companies have repeatedly said that the stock is not worth 1% of its current market value. Following are the statements and transactions that show this:
1. The acquisition of a majority of CFUL stock by UPDA. The preferred stock (representing at that time 77% of the total stock of Continental Fuels) was in payment of a debt of $5 million incurred when CFUL bought some assets from UPDA. By this metric, Continental Fuels is rightly worth $6.5 million. This puts the value of its stock at $0.011 per share.
From a recent 8k filing regarding the merger: “The consideration received by us from CFI for the Subsidiary Shares consisted of $2,500,000 in cash, payable within 30 days of the Effective Date, and 50,000 shares of CFI’s Series A Convertible Preferred Stock valued at $5,000,000 (the “Preferred Stock”). The Preferred Stock is currently convertible into 500,000,000 shares of CFI common stock and the Registrant has the right to vote the shares of Preferred Stock on an “as converted” basis in any matters for which the holders of CFI’s common stock are entitled to vote. Based on the number of shares of CFI common stock currently outstanding, as of the Effective Date the Registrant controlled seventy-seven percent (77%) of the voting stock of CFI.”
2. A large shareholder recently sold 100 million shares of CFUL to UPDA in exchange for 10,000 shares of UPDA Series preferred stock. That preferred stock is convertible into 200 million shares of UPDA stock, which at a recent market price of $.042 per share values the preferred stock at $8.4 million. Why would someone sell stock valued at $170 million for stock in a different company, worth $8.4 million? The simple reason is that CFUL is way overvalued, and Ms. Sandhu was rightly afraid that by the time she could sell her stock (it was restricted until February 2008) the stock would have tanked. If Ms. Sandhu gained nothing from this transaction, then this stock swap values CFUL at $48 million and each share at $.084.
From UPDA’s most recent 10Q: “On August 13, 2007, Ms. Karen Sandhu sold 100,000,000 shares out of 141,000,000 shares of Continental’s outstanding $.001 par value common stock held by her to UPDA for 10,000 shares of UPDA Series B Preferred Stock. UPDA made the purchase on behalf of Continental as treasury stock and was retired on the same day.”
also from the 10Q: “In July of 2007, certain holders of Series B preferred shares converted 3,520 Series B preferred shares into 70,400,000 common shares.”
3. Those shares (plus 40 million others) of CFUL that were sold by Karen Sandhu were acquired by her in a private placement in exchange for $200,000 on February 6, 2007.
From CFUL’s 10Q: “On February 6, 2007, Company completed the sale of 141,000,000 restricted shares of its post-2007 Reverse Split common stock to Ms. Karen Sandhu for $200,000 cash. Company used the proceeds from this offering to pay outstanding debts and liabilities.”
4. Continental’s 88% owner, UPDA, has a market cap of $33 million. If Continental Fuels was worth its current implied market cap, UPDA would be not only greatly undervalued but it would be the best investment of all time.
5. On August 17, 2007, Continental Fuels issued 12.6 million restricted shares to pay off a $100,000 debt, valuing those shares at $0.008 per share. Assuming a modest discount (20%) for the restricted shares, the company so much as said that it is worth $0.01 per share or $5.7 million.
From the 8k: “On August 17, 2007, the board of directors of the Registrant approved the conversion of an aggregate of one hundred thousand dollars ($100,000) of outstanding notes of the Registrant (the “Notes”) into shares of the Registrant’s common stock. Based upon the current assets and capitalization of the Registrant, the conversion price of the shares of common stock to be issued upon conversion of the Notes was valued at $0.008 per share by the Registrant’s board of directors. The conversion of the Notes to shares of the Registrant’s common stock is at the discretion of the Note holders. However, convertibility of the Notes is subject to certain limitations based on the number of shares of the Registrant’s common stock then outstanding. Upon the eventual full conversion of the Notes to common shares, the approved conversion of the Notes to common stock will result in the issuance by the Registrant of an aggregate of 12,615,326 restricted shares of its common stock.”
6. A similar transaction to #5 above took place back in April, valuing the company’s stock at $0.012 per share.
from the 8k dated 23 April 2007: “On April 25, 2007, the board of directors of the Registrant approved the conversion of an aggregate of one hundred thousand dollars ($100,000) of outstanding notes of the Registrant (the “Notes”) into shares of the Registrant’s common stock. Based upon the current assets and capitalization of the Registrant, the conversion price of the shares of common stock to be issued upon conversion of the Notes was valued at $0.012 per share by the Registrant’s board of directors. The conversion of the Notes to shares of the Registrant’s common stock is at the discretion of the Note holders. The eventual full conversion of the $100,000 in Notes to common stock will result in the issuance of an aggregate of 8,326,115 restricted shares of our common stock.”
When Will Sanity Return?
I have proven my case that Continental Fuels is incredibly overvalued. When should its valuation return to a realistic level? I am not sure, for it is never possible to predict stock price changes. However, it is a worthwhile exercise to examine a couple factors that will influence the price of the company’s stock.
1. UPDA has begun to convert its preferred shares to common shares of Continental Fuels. Consequently, it has decided to spinoff a number of these shares to its shareholders. A total of 787 million shares were outstanding as of the record date, and one share of CFUL will be distributed for each 50 shares of UPDA. This means that 16.7 million more shares of CFUL will hit the market, although not until August 1, 2008, because these shares are restricted from trading for one year. With only about 2 million shares trading currently (according to Yahoo Finance and verified by me from the company’s SEC filings), selling of a large chunk of those 16 million shares next August as the shares lose their restrictions will quickly depress the price.
From the press release on CFUL’s website: “According to the Board Resolution, one share of CFUL common stock will be distributed to UPDA’s common stockholders for every 50 shares of UPDA common stock held. Every UPDA common stockholder will receive at least one CFUL share in this distribution and fractional shares will be rounded up to the nearest whole number. The date of the distribution will be August 1, 2007 to UPDA’s common stockholders of record on July 11, 2007. Although the distributed shares will be restricted from transfer for one year pursuant to SEC Rule 144, UPDA has obtained an opinion that the shares will have no tax consequence to the recipient until they are sold or transferred.”
2. Every month since April the number of shares of CFUL sold short has increased dramatically. Currently (as of August 2007), 417,000 shares are sold short (see here and search for CFUL for updated numbers). Increased selling is inevitable as more short sellers (and stockholders) become aware of the company’s extreme overvaluation.
Conclusions
The absurd valuation of Continental Fuels despite highlights several problems with capital markets in the United States. In a future post I will address these problems and ways that financial market regulation can change this.
Disclosure: I am short Continental Fuels (OTC BB: CFUL.ob). I do not recommend investing in unlisted stocks or in shorting stocks, as both are very risky. Combining the two is perhaps even more risky and should be left to the brave, the foolhardy, and the professionals. I refuse to disclose to which of these categories I belong. See my disclosure policy.
I love revealing the ignorance of my critics
If you are bored, see SeekingAlpha and the comments on my post about Octillion (scroll to the bottom).
To my critics: if you are going to criticize me, at least try having your facts right. The one universal I have found is that people who ‘invest’ in the penny stocks I disparage tend not to think very deeply before lobbing crazy accusations. And they should be ashamed of themselves, because not only do they lose their own money in bad investments, they give money to fraudsters, fools, and useless dreamers, which means there is less money for legitimate and useful businesses.
Disclosure: I hate Octillion. I would short it if I could. But I can’t. So I am neither long nor short. My disclosure policy also hates Octillion and thinks it is worthless.
Press Release: Hedge Fund Gets Two Spots on Regent Communications Board
CINCINNATI, Sept. 14 /PRNewswire-FirstCall/ — Regent Communications, Inc. (Nasdaq: RGCI – News) today announced the appointment of John Ahn and Joseph Patrick Hannan to the Company’s Board of Directors. Messrs. Ahn and Hannan are filling two newly created seats, which increase the Company’s Board from five to seven members, including six independent members. Mr. Ahn will serve on the Board’s Nominating and Corporate Governance Committee and Mr. Hannan will serve on the Board’s Audit and Compensation Committees.
The Company also announced today that it has entered into an agreement with Riley Investment Management LLC and SMH Capital Inc. in which all pending litigation has been dismissed.
I previously mentioned Regent Communications [[rgci]] and its lawsuit against hedge fund Riley Investment Management.
Congratulations to Riley and to John Ahn. They can now get down to the business of squeezing value out of Regent.
Disclosure: I hold RGCI stock. My disclosure policy makes for good reading.
Morningstar on Three Great Healthcare Stocks
Morningstar has a great free article that explains why Pfizer [[pfe]], Johnson & Johnson [[jnj]], and Medtronic [[mdt]] are great buys.
Disclosure: I own none of the mentioned stocks.